Cypriot vs Immigrants from Ethiopia Family Households
COMPARE
Cypriot
Immigrants from Ethiopia
Family Households
Family Households Comparison
Cypriots
Immigrants from Ethiopia
63.2%
FAMILY HOUSEHOLDS
0.6/ 100
METRIC RATING
260th/ 347
METRIC RANK
61.2%
FAMILY HOUSEHOLDS
0.0/ 100
METRIC RATING
333rd/ 347
METRIC RANK
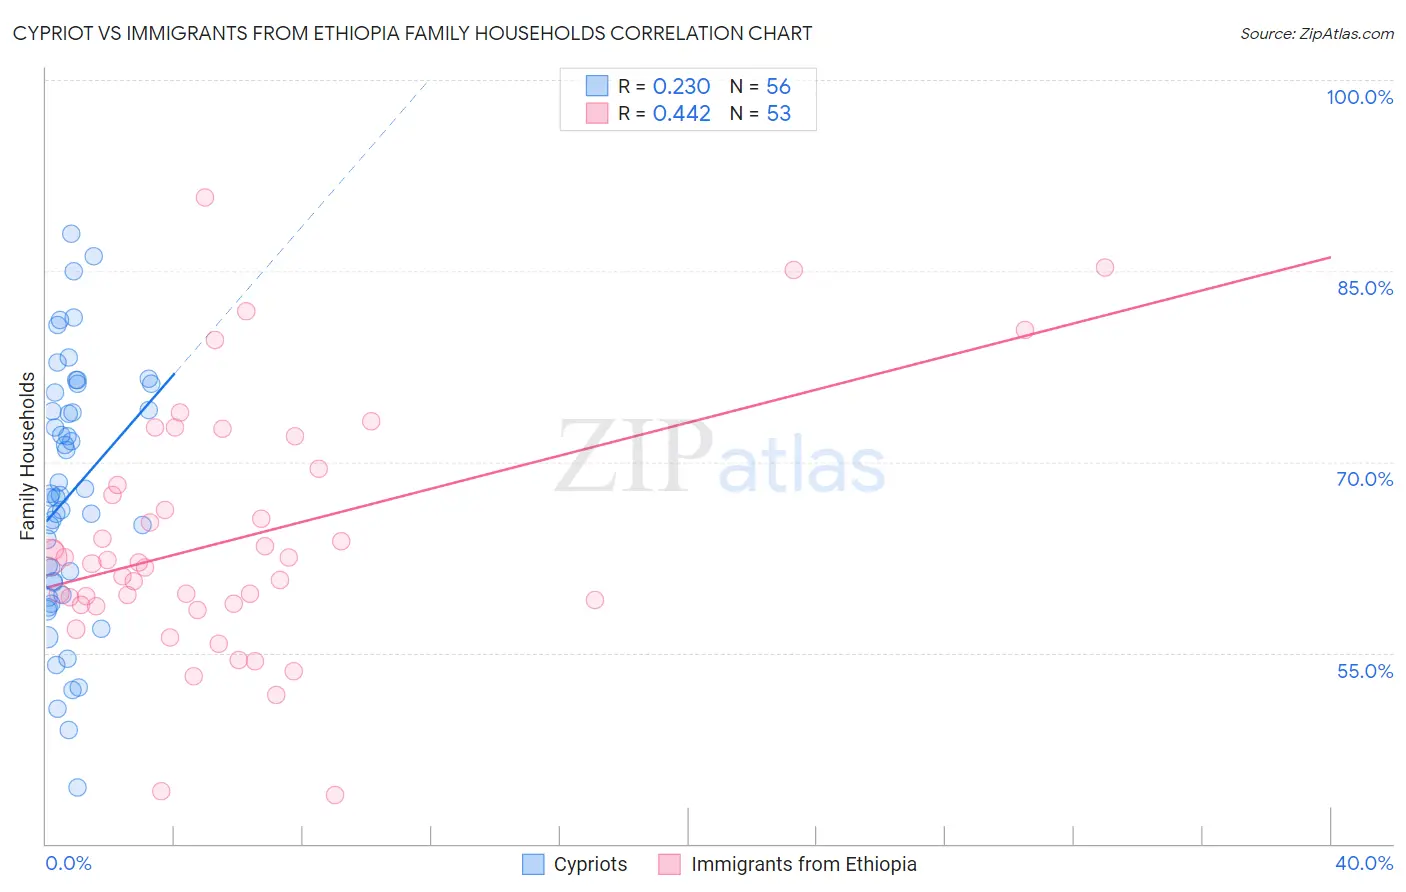
Cypriot vs Immigrants from Ethiopia Family Households Correlation Chart
The statistical analysis conducted on geographies consisting of 61,857,015 people shows a weak positive correlation between the proportion of Cypriots and percentage of family households in the United States with a correlation coefficient (R) of 0.230 and weighted average of 63.2%. Similarly, the statistical analysis conducted on geographies consisting of 211,469,180 people shows a moderate positive correlation between the proportion of Immigrants from Ethiopia and percentage of family households in the United States with a correlation coefficient (R) of 0.442 and weighted average of 61.2%, a difference of 3.3%.
Family Households Correlation Summary
| Measurement | Cypriot | Immigrants from Ethiopia |
| Minimum | 44.4% | 43.8% |
| Maximum | 87.9% | 90.8% |
| Range | 43.5% | 47.0% |
| Mean | 67.4% | 63.9% |
| Median | 67.3% | 62.1% |
| Interquartile 25% (IQ1) | 60.0% | 58.8% |
| Interquartile 75% (IQ3) | 74.7% | 68.8% |
| Interquartile Range (IQR) | 14.7% | 10.0% |
| Standard Deviation (Sample) | 9.9% | 9.6% |
| Standard Deviation (Population) | 9.8% | 9.6% |
Similar Demographics by Family Households
Demographics Similar to Cypriots by Family Households
In terms of family households, the demographic groups most similar to Cypriots are Immigrants from Western Europe (63.2%, a difference of 0.020%), Immigrants from Russia (63.2%, a difference of 0.020%), Immigrants from Barbados (63.2%, a difference of 0.030%), Immigrants from Ireland (63.2%, a difference of 0.030%), and Cheyenne (63.2%, a difference of 0.050%).
| Demographics | Rating | Rank | Family Households |
| Immigrants | Dominican Republic | 1.0 /100 | #253 | Tragic 63.3% |
| Slovaks | 1.0 /100 | #254 | Tragic 63.3% |
| Potawatomi | 1.0 /100 | #255 | Tragic 63.3% |
| Luxembourgers | 0.9 /100 | #256 | Tragic 63.3% |
| Icelanders | 0.8 /100 | #257 | Tragic 63.3% |
| Immigrants | Barbados | 0.7 /100 | #258 | Tragic 63.2% |
| Immigrants | Western Europe | 0.6 /100 | #259 | Tragic 63.2% |
| Cypriots | 0.6 /100 | #260 | Tragic 63.2% |
| Immigrants | Russia | 0.6 /100 | #261 | Tragic 63.2% |
| Immigrants | Ireland | 0.6 /100 | #262 | Tragic 63.2% |
| Cheyenne | 0.5 /100 | #263 | Tragic 63.2% |
| Kenyans | 0.5 /100 | #264 | Tragic 63.2% |
| Colville | 0.5 /100 | #265 | Tragic 63.2% |
| Immigrants | Western Africa | 0.5 /100 | #266 | Tragic 63.1% |
| Israelis | 0.4 /100 | #267 | Tragic 63.1% |
Demographics Similar to Immigrants from Ethiopia by Family Households
In terms of family households, the demographic groups most similar to Immigrants from Ethiopia are Ethiopian (61.2%, a difference of 0.080%), Immigrants from Eastern Africa (61.1%, a difference of 0.080%), Immigrants from Australia (61.3%, a difference of 0.16%), Immigrants from France (61.3%, a difference of 0.16%), and Carpatho Rusyn (61.1%, a difference of 0.20%).
| Demographics | Rating | Rank | Family Households |
| Indonesians | 0.0 /100 | #326 | Tragic 61.5% |
| Blacks/African Americans | 0.0 /100 | #327 | Tragic 61.5% |
| Kiowa | 0.0 /100 | #328 | Tragic 61.4% |
| Cambodians | 0.0 /100 | #329 | Tragic 61.4% |
| Immigrants | Australia | 0.0 /100 | #330 | Tragic 61.3% |
| Immigrants | France | 0.0 /100 | #331 | Tragic 61.3% |
| Ethiopians | 0.0 /100 | #332 | Tragic 61.2% |
| Immigrants | Ethiopia | 0.0 /100 | #333 | Tragic 61.2% |
| Immigrants | Eastern Africa | 0.0 /100 | #334 | Tragic 61.1% |
| Carpatho Rusyns | 0.0 /100 | #335 | Tragic 61.1% |
| German Russians | 0.0 /100 | #336 | Tragic 60.9% |
| Soviet Union | 0.0 /100 | #337 | Tragic 60.9% |
| Immigrants | Eritrea | 0.0 /100 | #338 | Tragic 60.8% |
| Immigrants | Saudi Arabia | 0.0 /100 | #339 | Tragic 60.7% |
| Immigrants | Sudan | 0.0 /100 | #340 | Tragic 60.2% |