Chinese vs Guamanian/Chamorro Family Households
COMPARE
Chinese
Guamanian/Chamorro
Family Households
Family Households Comparison
Chinese
Guamanians/Chamorros
68.1%
FAMILY HOUSEHOLDS
100.0/ 100
METRIC RATING
17th/ 347
METRIC RANK
66.6%
FAMILY HOUSEHOLDS
100.0/ 100
METRIC RATING
40th/ 347
METRIC RANK
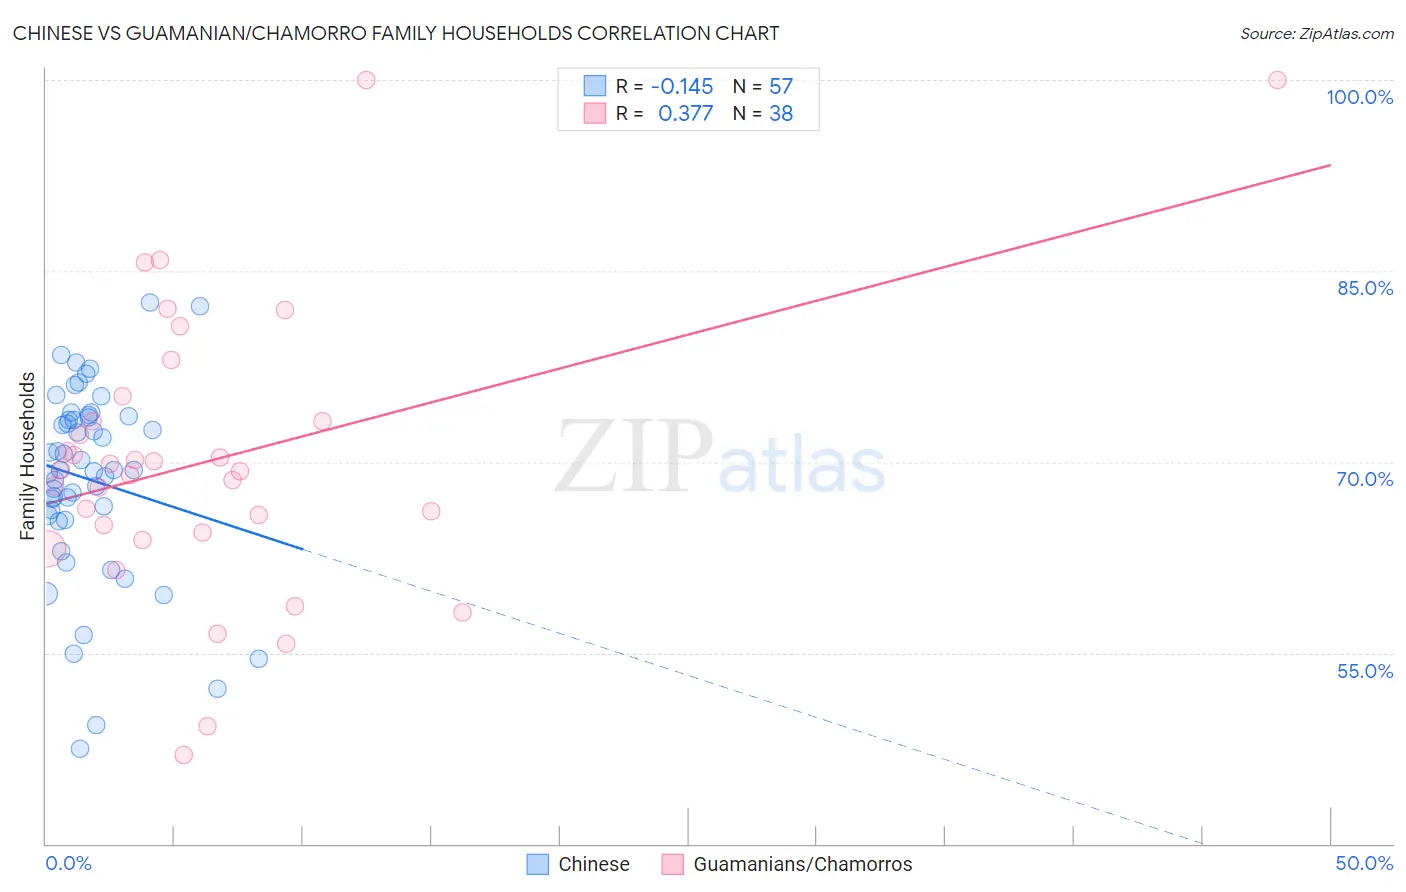
Chinese vs Guamanian/Chamorro Family Households Correlation Chart
The statistical analysis conducted on geographies consisting of 64,801,742 people shows a poor negative correlation between the proportion of Chinese and percentage of family households in the United States with a correlation coefficient (R) of -0.145 and weighted average of 68.1%. Similarly, the statistical analysis conducted on geographies consisting of 221,865,945 people shows a mild positive correlation between the proportion of Guamanians/Chamorros and percentage of family households in the United States with a correlation coefficient (R) of 0.377 and weighted average of 66.6%, a difference of 2.3%.
Family Households Correlation Summary
| Measurement | Chinese | Guamanian/Chamorro |
| Minimum | 47.5% | 47.0% |
| Maximum | 82.6% | 100.0% |
| Range | 35.1% | 53.0% |
| Mean | 68.6% | 70.1% |
| Median | 69.4% | 69.3% |
| Interquartile 25% (IQ1) | 65.6% | 64.4% |
| Interquartile 75% (IQ3) | 73.5% | 73.2% |
| Interquartile Range (IQR) | 7.9% | 8.8% |
| Standard Deviation (Sample) | 7.6% | 11.3% |
| Standard Deviation (Population) | 7.5% | 11.1% |
Similar Demographics by Family Households
Demographics Similar to Chinese by Family Households
In terms of family households, the demographic groups most similar to Chinese are Immigrants from Vietnam (68.2%, a difference of 0.030%), Assyrian/Chaldean/Syriac (68.2%, a difference of 0.040%), Pueblo (68.2%, a difference of 0.10%), Immigrants from Cuba (68.2%, a difference of 0.10%), and Immigrants from Taiwan (68.0%, a difference of 0.16%).
| Demographics | Rating | Rank | Family Households |
| Immigrants | Philippines | 100.0 /100 | #10 | Exceptional 68.3% |
| Immigrants | Central America | 100.0 /100 | #11 | Exceptional 68.3% |
| Koreans | 100.0 /100 | #12 | Exceptional 68.3% |
| Pueblo | 100.0 /100 | #13 | Exceptional 68.2% |
| Immigrants | Cuba | 100.0 /100 | #14 | Exceptional 68.2% |
| Assyrians/Chaldeans/Syriacs | 100.0 /100 | #15 | Exceptional 68.2% |
| Immigrants | Vietnam | 100.0 /100 | #16 | Exceptional 68.2% |
| Chinese | 100.0 /100 | #17 | Exceptional 68.1% |
| Immigrants | Taiwan | 100.0 /100 | #18 | Exceptional 68.0% |
| Samoans | 100.0 /100 | #19 | Exceptional 67.9% |
| Inupiat | 100.0 /100 | #20 | Exceptional 67.8% |
| Cubans | 100.0 /100 | #21 | Exceptional 67.7% |
| Sri Lankans | 100.0 /100 | #22 | Exceptional 67.7% |
| Immigrants | Pakistan | 100.0 /100 | #23 | Exceptional 67.7% |
| Immigrants | South Eastern Asia | 100.0 /100 | #24 | Exceptional 67.5% |
Demographics Similar to Guamanians/Chamorros by Family Households
In terms of family households, the demographic groups most similar to Guamanians/Chamorros are Immigrants from Bolivia (66.6%, a difference of 0.030%), Menominee (66.5%, a difference of 0.090%), Apache (66.5%, a difference of 0.10%), Asian (66.5%, a difference of 0.15%), and Venezuelan (66.5%, a difference of 0.17%).
| Demographics | Rating | Rank | Family Households |
| Salvadorans | 100.0 /100 | #33 | Exceptional 67.2% |
| Thais | 100.0 /100 | #34 | Exceptional 67.2% |
| Tohono O'odham | 100.0 /100 | #35 | Exceptional 67.1% |
| Peruvians | 100.0 /100 | #36 | Exceptional 67.1% |
| Tsimshian | 100.0 /100 | #37 | Exceptional 67.1% |
| Mexican American Indians | 100.0 /100 | #38 | Exceptional 67.0% |
| Immigrants | El Salvador | 100.0 /100 | #39 | Exceptional 67.0% |
| Guamanians/Chamorros | 100.0 /100 | #40 | Exceptional 66.6% |
| Immigrants | Bolivia | 100.0 /100 | #41 | Exceptional 66.6% |
| Menominee | 100.0 /100 | #42 | Exceptional 66.5% |
| Apache | 100.0 /100 | #43 | Exceptional 66.5% |
| Asians | 100.0 /100 | #44 | Exceptional 66.5% |
| Venezuelans | 100.0 /100 | #45 | Exceptional 66.5% |
| Arapaho | 100.0 /100 | #46 | Exceptional 66.5% |
| Bolivians | 100.0 /100 | #47 | Exceptional 66.5% |