Chinese vs Immigrants from Nicaragua Family Households
COMPARE
Chinese
Immigrants from Nicaragua
Family Households
Family Households Comparison
Chinese
Immigrants from Nicaragua
68.1%
FAMILY HOUSEHOLDS
100.0/ 100
METRIC RATING
17th/ 347
METRIC RANK
67.5%
FAMILY HOUSEHOLDS
100.0/ 100
METRIC RATING
25th/ 347
METRIC RANK
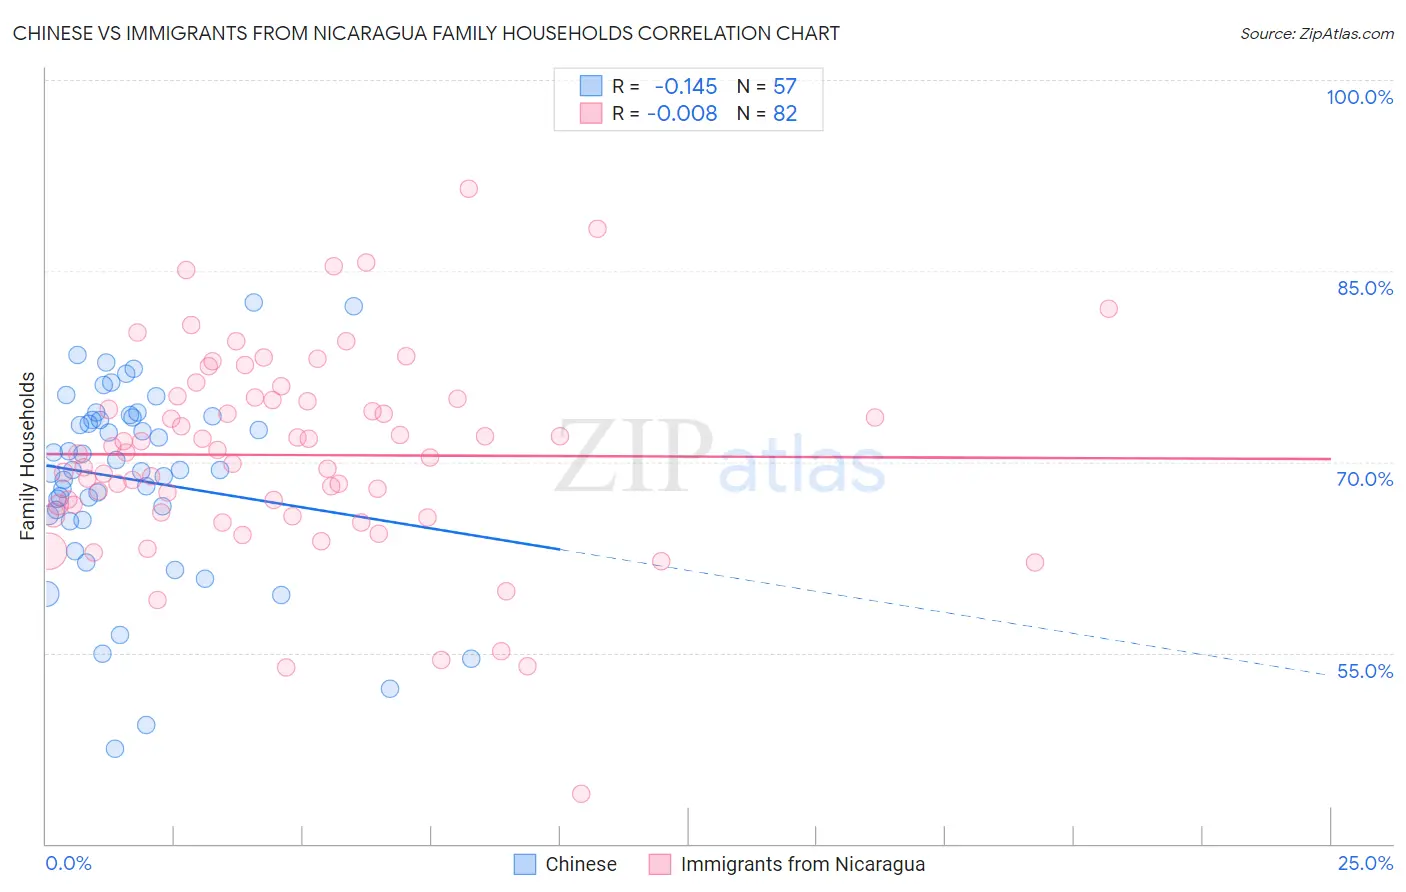
Chinese vs Immigrants from Nicaragua Family Households Correlation Chart
The statistical analysis conducted on geographies consisting of 64,801,742 people shows a poor negative correlation between the proportion of Chinese and percentage of family households in the United States with a correlation coefficient (R) of -0.145 and weighted average of 68.1%. Similarly, the statistical analysis conducted on geographies consisting of 236,325,985 people shows no correlation between the proportion of Immigrants from Nicaragua and percentage of family households in the United States with a correlation coefficient (R) of -0.008 and weighted average of 67.5%, a difference of 1.0%.
Family Households Correlation Summary
| Measurement | Chinese | Immigrants from Nicaragua |
| Minimum | 47.5% | 43.9% |
| Maximum | 82.6% | 91.5% |
| Range | 35.1% | 47.5% |
| Mean | 68.6% | 70.5% |
| Median | 69.4% | 70.7% |
| Interquartile 25% (IQ1) | 65.6% | 66.0% |
| Interquartile 75% (IQ3) | 73.5% | 75.0% |
| Interquartile Range (IQR) | 7.9% | 9.0% |
| Standard Deviation (Sample) | 7.6% | 8.0% |
| Standard Deviation (Population) | 7.5% | 7.9% |
Demographics Similar to Chinese and Immigrants from Nicaragua by Family Households
In terms of family households, the demographic groups most similar to Chinese are Immigrants from Vietnam (68.2%, a difference of 0.030%), Assyrian/Chaldean/Syriac (68.2%, a difference of 0.040%), Pueblo (68.2%, a difference of 0.10%), Immigrants from Cuba (68.2%, a difference of 0.10%), and Immigrants from Taiwan (68.0%, a difference of 0.16%). Similarly, the demographic groups most similar to Immigrants from Nicaragua are Immigrants from India (67.4%, a difference of 0.010%), Immigrants from South Eastern Asia (67.5%, a difference of 0.020%), Hispanic or Latino (67.4%, a difference of 0.050%), Hawaiian (67.4%, a difference of 0.070%), and Nicaraguan (67.4%, a difference of 0.14%).
| Demographics | Rating | Rank | Family Households |
| Immigrants | Central America | 100.0 /100 | #11 | Exceptional 68.3% |
| Koreans | 100.0 /100 | #12 | Exceptional 68.3% |
| Pueblo | 100.0 /100 | #13 | Exceptional 68.2% |
| Immigrants | Cuba | 100.0 /100 | #14 | Exceptional 68.2% |
| Assyrians/Chaldeans/Syriacs | 100.0 /100 | #15 | Exceptional 68.2% |
| Immigrants | Vietnam | 100.0 /100 | #16 | Exceptional 68.2% |
| Chinese | 100.0 /100 | #17 | Exceptional 68.1% |
| Immigrants | Taiwan | 100.0 /100 | #18 | Exceptional 68.0% |
| Samoans | 100.0 /100 | #19 | Exceptional 67.9% |
| Inupiat | 100.0 /100 | #20 | Exceptional 67.8% |
| Cubans | 100.0 /100 | #21 | Exceptional 67.7% |
| Sri Lankans | 100.0 /100 | #22 | Exceptional 67.7% |
| Immigrants | Pakistan | 100.0 /100 | #23 | Exceptional 67.7% |
| Immigrants | South Eastern Asia | 100.0 /100 | #24 | Exceptional 67.5% |
| Immigrants | Nicaragua | 100.0 /100 | #25 | Exceptional 67.5% |
| Immigrants | India | 100.0 /100 | #26 | Exceptional 67.4% |
| Hispanics or Latinos | 100.0 /100 | #27 | Exceptional 67.4% |
| Hawaiians | 100.0 /100 | #28 | Exceptional 67.4% |
| Nicaraguans | 100.0 /100 | #29 | Exceptional 67.4% |
| Immigrants | Peru | 100.0 /100 | #30 | Exceptional 67.2% |
| Immigrants | Latin America | 100.0 /100 | #31 | Exceptional 67.2% |