Immigrants from Kazakhstan vs Guamanian/Chamorro Family Households

COMPARE

Immigrants from Kazakhstan
Race
Ancestry
AfghanAfricanAlaska NativeAlaskan AthabascanAlbanianAleutAlsatianAmericanApacheArabArapahoArgentineanArmenianAssyrian/Chaldean/SyriacAustralianAustrianBahamianBangladeshiBarbadianBasqueBelgianBelizeanBermudanBhutaneseBlackfeetBolivianBrazilianBritishBritish West IndianBulgarianBurmeseCajunCambodianCanadianCape VerdeanCarpatho RusynCelticCentral AmericanCentral American IndianCherokeeCheyenneChickasawChileanChineseChippewaChoctawColombianColvilleComancheCosta RicanCreeCreekCroatianCrowCubanCypriotCzechCzechoslovakianDanishDelawareDominicanDutchDutch West IndianEastern EuropeanEcuadorianEgyptianEnglishEstonianEthiopianEuropeanFijianFilipinoFinnishFrenchFrench American IndianFrench CanadianGermanGerman RussianGhanaianGreekGuatemalanGuyaneseHaitianHmongHonduranHopiHoumaHungarianIcelanderIndian (Asian)IndonesianInupiatIranianIraqiIrishIroquoisIsraeliItalianJamaicanJapaneseJordanianKenyanKiowaKoreanLaotianLatvianLebaneseLiberianLithuanianLumbeeLuxembourgerMacedonianMalaysianMalteseMarshalleseMenomineeMexicanMexican American IndianMongolianMoroccanNative HawaiianNavajoNepaleseNew ZealanderNicaraguanNigerianNorthern EuropeanNorwegianOkinawanOsageOttawaPaiutePakistaniPalestinianPanamanianParaguayanPennsylvania GermanPeruvianPimaPolishPortuguesePotawatomiPuebloPuerto RicanPuget Sound SalishRomanianRussianSalvadoranSamoanScandinavianScotch-IrishScottishSeminoleSenegaleseSerbianShoshoneSierra LeoneanSiouxSlavicSlovakSloveneSomaliSouth AfricanSouth AmericanSouth American IndianSoviet UnionSpaniardSpanishSpanish AmericanSpanish American IndianSri LankanSubsaharan AfricanSudaneseSwedishSwissSyrianTaiwaneseThaiTlingit-HaidaTohono O'OdhamTonganTrinidadian and TobagonianTsimshianTurkishU.S. Virgin IslanderUgandanUkrainianUruguayanUteVenezuelanVietnameseWelshWest IndianYakamaYaquiYugoslavianYumanYup'ikZimbabwean
Immigration
NonimmigrantsImmigrantsAfghanistanAfricaAlbaniaArgentinaArmeniaAsiaAustraliaAustriaBahamasBangladeshBarbadosBelarusBelgiumBelizeBoliviaBosnia and HerzegovinaBrazilBulgariaBurma/MyanmarCabo VerdeCambodiaCameroonCanadaCaribbeanCentral AmericaChileChinaColombiaCongoCosta RicaCroatiaCubaCzechoslovakiaDenmarkDominicaDominican RepublicEastern AfricaEastern AsiaEastern EuropeEcuadorEgyptEl SalvadorEnglandEritreaEthiopiaEuropeFijiFranceGermanyGhanaGreeceGrenadaGuatemalaGuyanaHaitiHondurasHong KongHungaryIndiaIndonesiaIranIraqIrelandIsraelItalyJamaicaJapanJordanKazakhstanKenyaKoreaKuwaitLaosLatin AmericaLatviaLebanonLiberiaLithuaniaMalaysiaMexicoMicronesiaMiddle AfricaMoldovaMoroccoNepalNetherlandsNicaraguaNigeriaNorth AmericaNorth MacedoniaNorthern AfricaNorthern EuropeNorwayOceaniaPakistanPanamaPeruPhilippinesPolandPortugalRomaniaRussiaSaudi ArabiaScotlandSenegalSerbiaSierra LeoneSingaporeSomaliaSouth AfricaSouth AmericaSouth Central AsiaSouth Eastern AsiaSouthern EuropeSpainSri LankaSt. Vincent and the GrenadinesSudanSwedenSwitzerlandSyriaTaiwanThailandTrinidad and TobagoTurkeyUgandaUkraineUruguayUzbekistanVenezuelaVietnamWest IndiesWestern AfricaWestern AsiaWestern EuropeYemenZaireZimbabweAzores
Guamanian/Chamorro
Race
Ancestry
AfghanAfricanAlaska NativeAlaskan AthabascanAlbanianAleutAlsatianAmericanApacheArabArapahoArgentineanArmenianAssyrian/Chaldean/SyriacAustralianAustrianBahamianBangladeshiBarbadianBasqueBelgianBelizeanBermudanBhutaneseBlackfeetBolivianBrazilianBritishBritish West IndianBulgarianBurmeseCajunCambodianCanadianCape VerdeanCarpatho RusynCelticCentral AmericanCentral American IndianCherokeeCheyenneChickasawChileanChineseChippewaChoctawColombianColvilleComancheCosta RicanCreeCreekCroatianCrowCubanCypriotCzechCzechoslovakianDanishDelawareDominicanDutchDutch West IndianEastern EuropeanEcuadorianEgyptianEnglishEstonianEthiopianEuropeanFijianFilipinoFinnishFrenchFrench American IndianFrench CanadianGermanGerman RussianGhanaianGreekGuamanian/ChamorroGuatemalanGuyaneseHaitianHmongHonduranHopiHoumaHungarianIcelanderIndian (Asian)IndonesianInupiatIranianIraqiIrishIroquoisIsraeliItalianJamaicanJapaneseJordanianKenyanKiowaKoreanLaotianLatvianLebaneseLiberianLithuanianLumbeeLuxembourgerMacedonianMalaysianMalteseMarshalleseMenomineeMexicanMexican American IndianMongolianMoroccanNative HawaiianNavajoNepaleseNew ZealanderNicaraguanNigerianNorthern EuropeanNorwegianOkinawanOsageOttawaPaiutePakistaniPalestinianPanamanianParaguayanPennsylvania GermanPeruvianPimaPolishPortuguesePotawatomiPuebloPuerto RicanPuget Sound SalishRomanianRussianSalvadoranSamoanScandinavianScotch-IrishScottishSeminoleSenegaleseSerbianShoshoneSierra LeoneanSiouxSlavicSlovakSloveneSomaliSouth AfricanSouth AmericanSouth American IndianSoviet UnionSpaniardSpanishSpanish AmericanSpanish American IndianSri LankanSubsaharan AfricanSudaneseSwedishSwissSyrianTaiwaneseThaiTlingit-HaidaTohono O'OdhamTonganTrinidadian and TobagonianTsimshianTurkishU.S. Virgin IslanderUgandanUkrainianUruguayanUteVenezuelanVietnameseWelshWest IndianYakamaYaquiYugoslavianYumanYup'ikZimbabwean
Immigration
NonimmigrantsImmigrantsAfghanistanAfricaAlbaniaArgentinaArmeniaAsiaAustraliaAustriaBahamasBangladeshBarbadosBelarusBelgiumBelizeBoliviaBosnia and HerzegovinaBrazilBulgariaBurma/MyanmarCabo VerdeCambodiaCameroonCanadaCaribbeanCentral AmericaChileChinaColombiaCongoCosta RicaCroatiaCubaCzechoslovakiaDenmarkDominicaDominican RepublicEastern AfricaEastern AsiaEastern EuropeEcuadorEgyptEl SalvadorEnglandEritreaEthiopiaEuropeFijiFranceGermanyGhanaGreeceGrenadaGuatemalaGuyanaHaitiHondurasHong KongHungaryIndiaIndonesiaIranIraqIrelandIsraelItalyJamaicaJapanJordanKenyaKoreaKuwaitLaosLatin AmericaLatviaLebanonLiberiaLithuaniaMalaysiaMexicoMicronesiaMiddle AfricaMoldovaMoroccoNepalNetherlandsNicaraguaNigeriaNorth AmericaNorth MacedoniaNorthern AfricaNorthern EuropeNorwayOceaniaPakistanPanamaPeruPhilippinesPolandPortugalRomaniaRussiaSaudi ArabiaScotlandSenegalSerbiaSierra LeoneSingaporeSomaliaSouth AfricaSouth AmericaSouth Central AsiaSouth Eastern AsiaSouthern EuropeSpainSri LankaSt. Vincent and the GrenadinesSudanSwedenSwitzerlandSyriaTaiwanThailandTrinidad and TobagoTurkeyUgandaUkraineUruguayUzbekistanVenezuelaVietnamWest IndiesWestern AfricaWestern AsiaWestern EuropeYemenZaireZimbabweAzores
Family Households
Income
Poverty
Unemployment
Labor Participation
Family Structure
Vehicle Availability
Education Level
Disability

Family Households Comparison

Immigrants from Kazakhstan

Guamanians/Chamorros

Tragic
Exceptional
63.1%
FAMILY HOUSEHOLDS
0.3/ 100
METRIC RATING
273rd/ 347
METRIC RANK
66.6%
FAMILY HOUSEHOLDS
100.0/ 100
METRIC RATING
40th/ 347
METRIC RANK

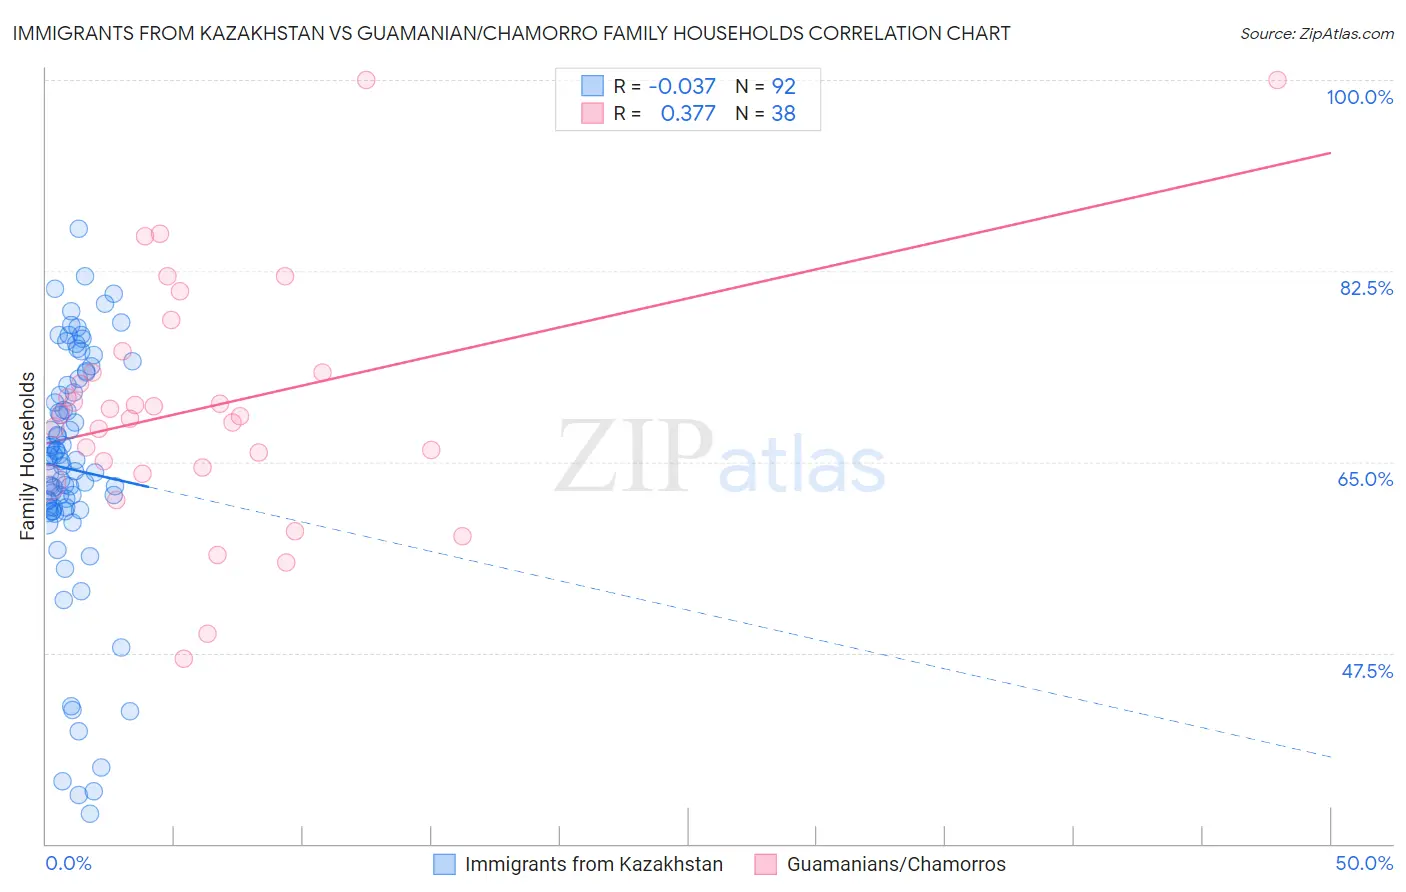
Immigrants from Kazakhstan vs Guamanian/Chamorro Family Households Correlation Chart

The statistical analysis conducted on geographies consisting of 124,429,118 people shows no correlation between the proportion of Immigrants from Kazakhstan and percentage of family households in the United States with a correlation coefficient (R) of -0.037 and weighted average of 63.1%. Similarly, the statistical analysis conducted on geographies consisting of 221,865,945 people shows a mild positive correlation between the proportion of Guamanians/Chamorros and percentage of family households in the United States with a correlation coefficient (R) of 0.377 and weighted average of 66.6%, a difference of 5.6%.
Immigrants from Kazakhstan vs Guamanian/Chamorro Family Households

Family Households Correlation Summary

MeasurementImmigrants from KazakhstanGuamanian/Chamorro
Minimum32.8%47.0%
Maximum86.3%100.0%
Range53.6%53.0%
Mean64.3%70.1%
Median65.0%69.3%
Interquartile 25% (IQ1)60.7%64.4%
Interquartile 75% (IQ3)72.3%73.2%
Interquartile Range (IQR)11.7%8.8%
Standard Deviation (Sample)11.3%11.3%
Standard Deviation (Population)11.3%11.1%

Similar Demographics by Family Households

Demographics Similar to Immigrants from Kazakhstan by Family Households

In terms of family households, the demographic groups most similar to Immigrants from Kazakhstan are Immigrants from Croatia (63.1%, a difference of 0.010%), Immigrants from Turkey (63.1%, a difference of 0.010%), Lumbee (63.1%, a difference of 0.010%), West Indian (63.1%, a difference of 0.010%), and Immigrants from Austria (63.1%, a difference of 0.020%).
DemographicsRating | RankFamily Households
Immigrants | Western Africa
0.5
/100
|
#266
Tragic
63.1%
Israelis
0.4
/100
|
#267
Tragic
63.1%
Immigrants | Singapore
0.4
/100
|
#268
Tragic
63.1%
Yugoslavians
0.4
/100
|
#269
Tragic
63.1%
Immigrants | Austria
0.3
/100
|
#270
Tragic
63.1%
Immigrants | Croatia
0.3
/100
|
#271
Tragic
63.1%
Immigrants | Turkey
0.3
/100
|
#272
Tragic
63.1%
Immigrants | Kazakhstan
0.3
/100
|
#273
Tragic
63.1%
Lumbee
0.3
/100
|
#274
Tragic
63.1%
West Indians
0.3
/100
|
#275
Tragic
63.1%
Serbians
0.3
/100
|
#276
Tragic
63.0%
Ottawa
0.3
/100
|
#277
Tragic
63.0%
Immigrants | Belgium
0.2
/100
|
#278
Tragic
63.0%
Immigrants | Yemen
0.2
/100
|
#279
Tragic
63.0%
Immigrants | Bulgaria
0.2
/100
|
#280
Tragic
63.0%

Demographics Similar to Guamanians/Chamorros by Family Households

In terms of family households, the demographic groups most similar to Guamanians/Chamorros are Immigrants from Bolivia (66.6%, a difference of 0.030%), Menominee (66.5%, a difference of 0.090%), Apache (66.5%, a difference of 0.10%), Asian (66.5%, a difference of 0.15%), and Venezuelan (66.5%, a difference of 0.17%).
DemographicsRating | RankFamily Households
Salvadorans
100.0
/100
|
#33
Exceptional
67.2%
Thais
100.0
/100
|
#34
Exceptional
67.2%
Tohono O'odham
100.0
/100
|
#35
Exceptional
67.1%
Peruvians
100.0
/100
|
#36
Exceptional
67.1%
Tsimshian
100.0
/100
|
#37
Exceptional
67.1%
Mexican American Indians
100.0
/100
|
#38
Exceptional
67.0%
Immigrants | El Salvador
100.0
/100
|
#39
Exceptional
67.0%
Guamanians/Chamorros
100.0
/100
|
#40
Exceptional
66.6%
Immigrants | Bolivia
100.0
/100
|
#41
Exceptional
66.6%
Menominee
100.0
/100
|
#42
Exceptional
66.5%
Apache
100.0
/100
|
#43
Exceptional
66.5%
Asians
100.0
/100
|
#44
Exceptional
66.5%
Venezuelans
100.0
/100
|
#45
Exceptional
66.5%
Arapaho
100.0
/100
|
#46
Exceptional
66.5%
Bolivians
100.0
/100
|
#47
Exceptional
66.5%