Chinese vs Immigrants from Eastern Europe Family Households
COMPARE
Chinese
Immigrants from Eastern Europe
Family Households
Family Households Comparison
Chinese
Immigrants from Eastern Europe
68.1%
FAMILY HOUSEHOLDS
100.0/ 100
METRIC RATING
17th/ 347
METRIC RANK
64.0%
FAMILY HOUSEHOLDS
17.2/ 100
METRIC RATING
201st/ 347
METRIC RANK
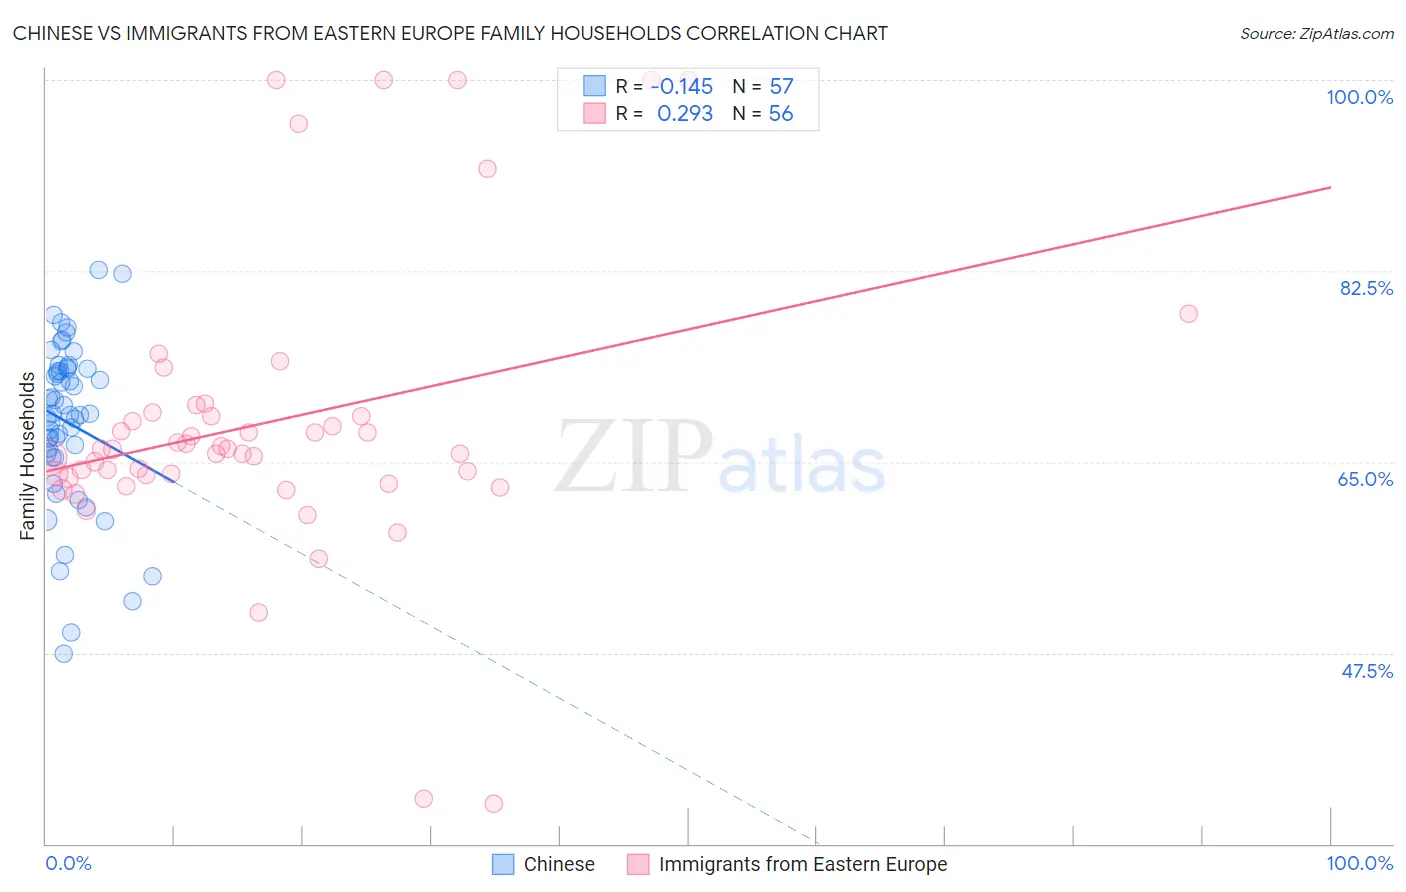
Chinese vs Immigrants from Eastern Europe Family Households Correlation Chart
The statistical analysis conducted on geographies consisting of 64,801,742 people shows a poor negative correlation between the proportion of Chinese and percentage of family households in the United States with a correlation coefficient (R) of -0.145 and weighted average of 68.1%. Similarly, the statistical analysis conducted on geographies consisting of 475,514,263 people shows a weak positive correlation between the proportion of Immigrants from Eastern Europe and percentage of family households in the United States with a correlation coefficient (R) of 0.293 and weighted average of 64.0%, a difference of 6.5%.
Family Households Correlation Summary
| Measurement | Chinese | Immigrants from Eastern Europe |
| Minimum | 47.5% | 33.7% |
| Maximum | 82.6% | 100.0% |
| Range | 35.1% | 66.3% |
| Mean | 68.6% | 68.7% |
| Median | 69.4% | 66.2% |
| Interquartile 25% (IQ1) | 65.6% | 63.7% |
| Interquartile 75% (IQ3) | 73.5% | 69.4% |
| Interquartile Range (IQR) | 7.9% | 5.7% |
| Standard Deviation (Sample) | 7.6% | 13.5% |
| Standard Deviation (Population) | 7.5% | 13.4% |
Similar Demographics by Family Households
Demographics Similar to Chinese by Family Households
In terms of family households, the demographic groups most similar to Chinese are Immigrants from Vietnam (68.2%, a difference of 0.030%), Assyrian/Chaldean/Syriac (68.2%, a difference of 0.040%), Pueblo (68.2%, a difference of 0.10%), Immigrants from Cuba (68.2%, a difference of 0.10%), and Immigrants from Taiwan (68.0%, a difference of 0.16%).
| Demographics | Rating | Rank | Family Households |
| Immigrants | Philippines | 100.0 /100 | #10 | Exceptional 68.3% |
| Immigrants | Central America | 100.0 /100 | #11 | Exceptional 68.3% |
| Koreans | 100.0 /100 | #12 | Exceptional 68.3% |
| Pueblo | 100.0 /100 | #13 | Exceptional 68.2% |
| Immigrants | Cuba | 100.0 /100 | #14 | Exceptional 68.2% |
| Assyrians/Chaldeans/Syriacs | 100.0 /100 | #15 | Exceptional 68.2% |
| Immigrants | Vietnam | 100.0 /100 | #16 | Exceptional 68.2% |
| Chinese | 100.0 /100 | #17 | Exceptional 68.1% |
| Immigrants | Taiwan | 100.0 /100 | #18 | Exceptional 68.0% |
| Samoans | 100.0 /100 | #19 | Exceptional 67.9% |
| Inupiat | 100.0 /100 | #20 | Exceptional 67.8% |
| Cubans | 100.0 /100 | #21 | Exceptional 67.7% |
| Sri Lankans | 100.0 /100 | #22 | Exceptional 67.7% |
| Immigrants | Pakistan | 100.0 /100 | #23 | Exceptional 67.7% |
| Immigrants | South Eastern Asia | 100.0 /100 | #24 | Exceptional 67.5% |
Demographics Similar to Immigrants from Eastern Europe by Family Households
In terms of family households, the demographic groups most similar to Immigrants from Eastern Europe are Immigrants from Malaysia (64.0%, a difference of 0.020%), Slavic (64.0%, a difference of 0.030%), Immigrants from Canada (64.0%, a difference of 0.040%), Seminole (64.0%, a difference of 0.040%), and Polish (64.0%, a difference of 0.040%).
| Demographics | Rating | Rank | Family Households |
| Paiute | 22.2 /100 | #194 | Fair 64.0% |
| Immigrants | North America | 20.0 /100 | #195 | Poor 64.0% |
| Immigrants | Canada | 19.2 /100 | #196 | Poor 64.0% |
| Seminole | 18.9 /100 | #197 | Poor 64.0% |
| Poles | 18.9 /100 | #198 | Poor 64.0% |
| Slavs | 18.6 /100 | #199 | Poor 64.0% |
| Immigrants | Malaysia | 17.9 /100 | #200 | Poor 64.0% |
| Immigrants | Eastern Europe | 17.2 /100 | #201 | Poor 64.0% |
| Iranians | 13.5 /100 | #202 | Poor 63.9% |
| Norwegians | 13.2 /100 | #203 | Poor 63.9% |
| Immigrants | Uruguay | 12.8 /100 | #204 | Poor 63.9% |
| Brazilians | 12.4 /100 | #205 | Poor 63.9% |
| Immigrants | Lithuania | 12.1 /100 | #206 | Poor 63.9% |
| Nigerians | 11.5 /100 | #207 | Poor 63.9% |
| Immigrants | Bangladesh | 11.4 /100 | #208 | Poor 63.9% |