Chinese vs Dutch West Indian Family Households
COMPARE
Chinese
Dutch West Indian
Family Households
Family Households Comparison
Chinese
Dutch West Indians
68.1%
FAMILY HOUSEHOLDS
100.0/ 100
METRIC RATING
17th/ 347
METRIC RANK
64.3%
FAMILY HOUSEHOLDS
53.9/ 100
METRIC RATING
172nd/ 347
METRIC RANK
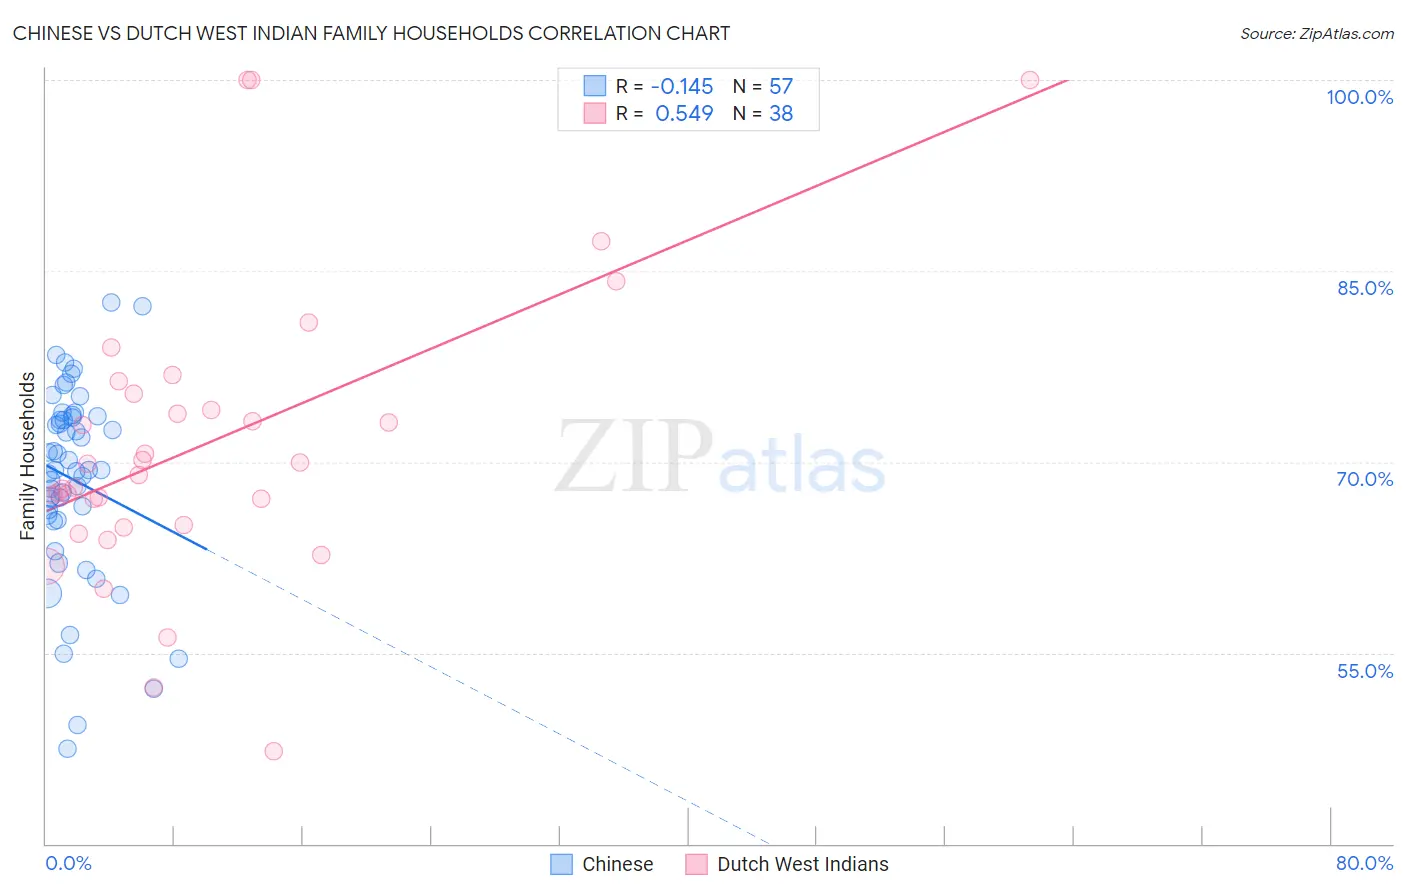
Chinese vs Dutch West Indian Family Households Correlation Chart
The statistical analysis conducted on geographies consisting of 64,801,742 people shows a poor negative correlation between the proportion of Chinese and percentage of family households in the United States with a correlation coefficient (R) of -0.145 and weighted average of 68.1%. Similarly, the statistical analysis conducted on geographies consisting of 85,766,530 people shows a substantial positive correlation between the proportion of Dutch West Indians and percentage of family households in the United States with a correlation coefficient (R) of 0.549 and weighted average of 64.3%, a difference of 5.9%.
Family Households Correlation Summary
| Measurement | Chinese | Dutch West Indian |
| Minimum | 47.5% | 47.2% |
| Maximum | 82.6% | 100.0% |
| Range | 35.1% | 52.8% |
| Mean | 68.6% | 71.4% |
| Median | 69.4% | 69.4% |
| Interquartile 25% (IQ1) | 65.6% | 65.0% |
| Interquartile 75% (IQ3) | 73.5% | 75.3% |
| Interquartile Range (IQR) | 7.9% | 10.3% |
| Standard Deviation (Sample) | 7.6% | 11.5% |
| Standard Deviation (Population) | 7.5% | 11.4% |
Similar Demographics by Family Households
Demographics Similar to Chinese by Family Households
In terms of family households, the demographic groups most similar to Chinese are Immigrants from Vietnam (68.2%, a difference of 0.030%), Assyrian/Chaldean/Syriac (68.2%, a difference of 0.040%), Pueblo (68.2%, a difference of 0.10%), Immigrants from Cuba (68.2%, a difference of 0.10%), and Immigrants from Taiwan (68.0%, a difference of 0.16%).
| Demographics | Rating | Rank | Family Households |
| Immigrants | Philippines | 100.0 /100 | #10 | Exceptional 68.3% |
| Immigrants | Central America | 100.0 /100 | #11 | Exceptional 68.3% |
| Koreans | 100.0 /100 | #12 | Exceptional 68.3% |
| Pueblo | 100.0 /100 | #13 | Exceptional 68.2% |
| Immigrants | Cuba | 100.0 /100 | #14 | Exceptional 68.2% |
| Assyrians/Chaldeans/Syriacs | 100.0 /100 | #15 | Exceptional 68.2% |
| Immigrants | Vietnam | 100.0 /100 | #16 | Exceptional 68.2% |
| Chinese | 100.0 /100 | #17 | Exceptional 68.1% |
| Immigrants | Taiwan | 100.0 /100 | #18 | Exceptional 68.0% |
| Samoans | 100.0 /100 | #19 | Exceptional 67.9% |
| Inupiat | 100.0 /100 | #20 | Exceptional 67.8% |
| Cubans | 100.0 /100 | #21 | Exceptional 67.7% |
| Sri Lankans | 100.0 /100 | #22 | Exceptional 67.7% |
| Immigrants | Pakistan | 100.0 /100 | #23 | Exceptional 67.7% |
| Immigrants | South Eastern Asia | 100.0 /100 | #24 | Exceptional 67.5% |
Demographics Similar to Dutch West Indians by Family Households
In terms of family households, the demographic groups most similar to Dutch West Indians are Ute (64.3%, a difference of 0.010%), Immigrants from Sierra Leone (64.3%, a difference of 0.020%), Iraqi (64.4%, a difference of 0.030%), Armenian (64.4%, a difference of 0.030%), and Irish (64.4%, a difference of 0.050%).
| Demographics | Rating | Rank | Family Households |
| Immigrants | Southern Europe | 60.0 /100 | #165 | Good 64.4% |
| Scotch-Irish | 59.2 /100 | #166 | Average 64.4% |
| Irish | 57.9 /100 | #167 | Average 64.4% |
| Hondurans | 57.5 /100 | #168 | Average 64.4% |
| Iraqis | 56.0 /100 | #169 | Average 64.4% |
| Armenians | 55.9 /100 | #170 | Average 64.4% |
| Ute | 54.6 /100 | #171 | Average 64.3% |
| Dutch West Indians | 53.9 /100 | #172 | Average 64.3% |
| Immigrants | Sierra Leone | 52.5 /100 | #173 | Average 64.3% |
| Immigrants | Germany | 50.0 /100 | #174 | Average 64.3% |
| Bangladeshis | 44.3 /100 | #175 | Average 64.3% |
| Vietnamese | 43.6 /100 | #176 | Average 64.2% |
| Immigrants | Micronesia | 42.3 /100 | #177 | Average 64.2% |
| Jamaicans | 40.6 /100 | #178 | Average 64.2% |
| Immigrants | Ukraine | 38.2 /100 | #179 | Fair 64.2% |