Chickasaw vs Immigrants from Israel Family Households

COMPARE

Chickasaw
Race
Ancestry
AfghanAfricanAlaska NativeAlaskan AthabascanAlbanianAleutAlsatianAmericanApacheArabArapahoArgentineanArmenianAssyrian/Chaldean/SyriacAustralianAustrianBahamianBangladeshiBarbadianBasqueBelgianBelizeanBermudanBhutaneseBlackfeetBolivianBrazilianBritishBritish West IndianBulgarianBurmeseCajunCambodianCanadianCape VerdeanCarpatho RusynCelticCentral AmericanCentral American IndianCherokeeCheyenneChickasawChileanChineseChippewaChoctawColombianColvilleComancheCosta RicanCreeCreekCroatianCrowCubanCypriotCzechCzechoslovakianDanishDelawareDominicanDutchDutch West IndianEastern EuropeanEcuadorianEgyptianEnglishEstonianEthiopianEuropeanFijianFilipinoFinnishFrenchFrench American IndianFrench CanadianGermanGerman RussianGhanaianGreekGuamanian/ChamorroGuatemalanGuyaneseHaitianHmongHonduranHopiHoumaHungarianIcelanderIndian (Asian)IndonesianInupiatIranianIraqiIrishIroquoisIsraeliItalianJamaicanJapaneseJordanianKenyanKiowaKoreanLaotianLatvianLebaneseLiberianLithuanianLumbeeLuxembourgerMacedonianMalaysianMalteseMarshalleseMenomineeMexicanMexican American IndianMongolianMoroccanNative HawaiianNavajoNepaleseNew ZealanderNicaraguanNigerianNorthern EuropeanNorwegianOkinawanOsageOttawaPaiutePakistaniPalestinianPanamanianParaguayanPennsylvania GermanPeruvianPimaPolishPortuguesePotawatomiPuebloPuerto RicanPuget Sound SalishRomanianRussianSalvadoranSamoanScandinavianScotch-IrishScottishSeminoleSenegaleseSerbianShoshoneSierra LeoneanSiouxSlavicSlovakSloveneSomaliSouth AfricanSouth AmericanSouth American IndianSoviet UnionSpaniardSpanishSpanish AmericanSpanish American IndianSri LankanSubsaharan AfricanSudaneseSwedishSwissSyrianTaiwaneseThaiTlingit-HaidaTohono O'OdhamTonganTrinidadian and TobagonianTsimshianTurkishU.S. Virgin IslanderUgandanUkrainianUruguayanUteVenezuelanVietnameseWelshWest IndianYakamaYaquiYugoslavianYumanYup'ikZimbabwean
Immigration
NonimmigrantsImmigrantsAfghanistanAfricaAlbaniaArgentinaArmeniaAsiaAustraliaAustriaBahamasBangladeshBarbadosBelarusBelgiumBelizeBoliviaBosnia and HerzegovinaBrazilBulgariaBurma/MyanmarCabo VerdeCambodiaCameroonCanadaCaribbeanCentral AmericaChileChinaColombiaCongoCosta RicaCroatiaCubaCzechoslovakiaDenmarkDominicaDominican RepublicEastern AfricaEastern AsiaEastern EuropeEcuadorEgyptEl SalvadorEnglandEritreaEthiopiaEuropeFijiFranceGermanyGhanaGreeceGrenadaGuatemalaGuyanaHaitiHondurasHong KongHungaryIndiaIndonesiaIranIraqIrelandItalyJamaicaJapanJordanKazakhstanKenyaKoreaKuwaitLaosLatin AmericaLatviaLebanonLiberiaLithuaniaMalaysiaMexicoMicronesiaMiddle AfricaMoldovaMoroccoNepalNetherlandsNicaraguaNigeriaNorth AmericaNorth MacedoniaNorthern AfricaNorthern EuropeNorwayOceaniaPakistanPanamaPeruPhilippinesPolandPortugalRomaniaRussiaSaudi ArabiaScotlandSenegalSerbiaSierra LeoneSingaporeSomaliaSouth AfricaSouth AmericaSouth Central AsiaSouth Eastern AsiaSouthern EuropeSpainSri LankaSt. Vincent and the GrenadinesSudanSwedenSwitzerlandSyriaTaiwanThailandTrinidad and TobagoTurkeyUgandaUkraineUruguayUzbekistanVenezuelaVietnamWest IndiesWestern AfricaWestern AsiaWestern EuropeYemenZaireZimbabweAzores
Immigrants from Israel
Race
Ancestry
AfghanAfricanAlaska NativeAlaskan AthabascanAlbanianAleutAlsatianAmericanApacheArabArapahoArgentineanArmenianAssyrian/Chaldean/SyriacAustralianAustrianBahamianBangladeshiBarbadianBasqueBelgianBelizeanBermudanBhutaneseBlackfeetBolivianBrazilianBritishBritish West IndianBulgarianBurmeseCajunCambodianCanadianCape VerdeanCarpatho RusynCelticCentral AmericanCentral American IndianCherokeeCheyenneChileanChineseChippewaChoctawColombianColvilleComancheCosta RicanCreeCreekCroatianCrowCubanCypriotCzechCzechoslovakianDanishDelawareDominicanDutchDutch West IndianEastern EuropeanEcuadorianEgyptianEnglishEstonianEthiopianEuropeanFijianFilipinoFinnishFrenchFrench American IndianFrench CanadianGermanGerman RussianGhanaianGreekGuamanian/ChamorroGuatemalanGuyaneseHaitianHmongHonduranHopiHoumaHungarianIcelanderIndian (Asian)IndonesianInupiatIranianIraqiIrishIroquoisIsraeliItalianJamaicanJapaneseJordanianKenyanKiowaKoreanLaotianLatvianLebaneseLiberianLithuanianLumbeeLuxembourgerMacedonianMalaysianMalteseMarshalleseMenomineeMexicanMexican American IndianMongolianMoroccanNative HawaiianNavajoNepaleseNew ZealanderNicaraguanNigerianNorthern EuropeanNorwegianOkinawanOsageOttawaPaiutePakistaniPalestinianPanamanianParaguayanPennsylvania GermanPeruvianPimaPolishPortuguesePotawatomiPuebloPuerto RicanPuget Sound SalishRomanianRussianSalvadoranSamoanScandinavianScotch-IrishScottishSeminoleSenegaleseSerbianShoshoneSierra LeoneanSiouxSlavicSlovakSloveneSomaliSouth AfricanSouth AmericanSouth American IndianSoviet UnionSpaniardSpanishSpanish AmericanSpanish American IndianSri LankanSubsaharan AfricanSudaneseSwedishSwissSyrianTaiwaneseThaiTlingit-HaidaTohono O'OdhamTonganTrinidadian and TobagonianTsimshianTurkishU.S. Virgin IslanderUgandanUkrainianUruguayanUteVenezuelanVietnameseWelshWest IndianYakamaYaquiYugoslavianYumanYup'ikZimbabwean
Immigration
NonimmigrantsImmigrantsAfghanistanAfricaAlbaniaArgentinaArmeniaAsiaAustraliaAustriaBahamasBangladeshBarbadosBelarusBelgiumBelizeBoliviaBosnia and HerzegovinaBrazilBulgariaBurma/MyanmarCabo VerdeCambodiaCameroonCanadaCaribbeanCentral AmericaChileChinaColombiaCongoCosta RicaCroatiaCubaCzechoslovakiaDenmarkDominicaDominican RepublicEastern AfricaEastern AsiaEastern EuropeEcuadorEgyptEl SalvadorEnglandEritreaEthiopiaEuropeFijiFranceGermanyGhanaGreeceGrenadaGuatemalaGuyanaHaitiHondurasHong KongHungaryIndiaIndonesiaIranIraqIrelandIsraelItalyJamaicaJapanJordanKazakhstanKenyaKoreaKuwaitLaosLatin AmericaLatviaLebanonLiberiaLithuaniaMalaysiaMexicoMicronesiaMiddle AfricaMoldovaMoroccoNepalNetherlandsNicaraguaNigeriaNorth AmericaNorth MacedoniaNorthern AfricaNorthern EuropeNorwayOceaniaPakistanPanamaPeruPhilippinesPolandPortugalRomaniaRussiaSaudi ArabiaScotlandSenegalSerbiaSierra LeoneSingaporeSomaliaSouth AfricaSouth AmericaSouth Central AsiaSouth Eastern AsiaSouthern EuropeSpainSri LankaSt. Vincent and the GrenadinesSudanSwedenSwitzerlandSyriaTaiwanThailandTrinidad and TobagoTurkeyUgandaUkraineUruguayUzbekistanVenezuelaVietnamWest IndiesWestern AfricaWestern AsiaWestern EuropeYemenZaireZimbabweAzores
Family Households
Income
Poverty
Unemployment
Labor Participation
Family Structure
Vehicle Availability
Education Level
Disability

Family Households Comparison

Chickasaw

Immigrants from Israel

Good
Tragic
64.4%
FAMILY HOUSEHOLDS
61.5/ 100
METRIC RATING
163rd/ 347
METRIC RANK
63.4%
FAMILY HOUSEHOLDS
1.8/ 100
METRIC RATING
242nd/ 347
METRIC RANK

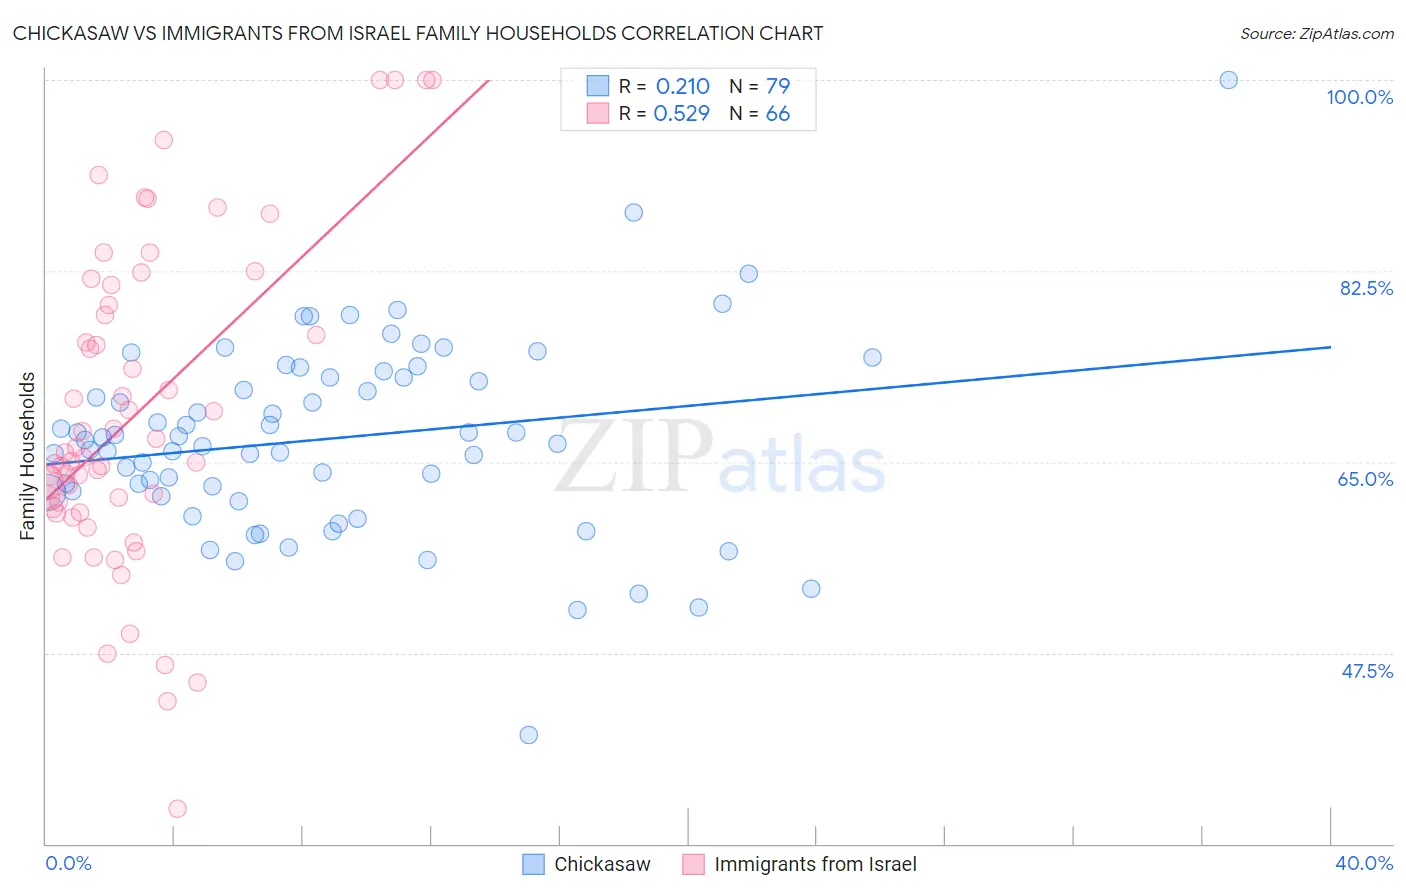
Chickasaw vs Immigrants from Israel Family Households Correlation Chart

The statistical analysis conducted on geographies consisting of 147,674,365 people shows a weak positive correlation between the proportion of Chickasaw and percentage of family households in the United States with a correlation coefficient (R) of 0.210 and weighted average of 64.4%. Similarly, the statistical analysis conducted on geographies consisting of 209,979,754 people shows a substantial positive correlation between the proportion of Immigrants from Israel and percentage of family households in the United States with a correlation coefficient (R) of 0.529 and weighted average of 63.4%, a difference of 1.5%.
Chickasaw vs Immigrants from Israel Family Households

Family Households Correlation Summary

MeasurementChickasawImmigrants from Israel
Minimum40.0%33.2%
Maximum100.0%100.0%
Range60.0%66.8%
Mean67.1%69.4%
Median67.0%65.6%
Interquartile 25% (IQ1)62.2%60.8%
Interquartile 75% (IQ3)72.8%79.4%
Interquartile Range (IQR)10.6%18.6%
Standard Deviation (Sample)8.9%14.6%
Standard Deviation (Population)8.8%14.5%

Similar Demographics by Family Households

Demographics Similar to Chickasaw by Family Households

In terms of family households, the demographic groups most similar to Chickasaw are British (64.4%, a difference of 0.0%), Immigrants from England (64.4%, a difference of 0.020%), Immigrants from Nigeria (64.4%, a difference of 0.020%), Immigrants from Southern Europe (64.4%, a difference of 0.020%), and Scotch-Irish (64.4%, a difference of 0.030%).
DemographicsRating | RankFamily Households
Czechs
67.0
/100
|
#156
Good
64.5%
Canadians
66.6
/100
|
#157
Good
64.4%
Lebanese
66.4
/100
|
#158
Good
64.4%
Germans
65.8
/100
|
#159
Good
64.4%
Immigrants | Moldova
65.2
/100
|
#160
Good
64.4%
Immigrants | England
62.6
/100
|
#161
Good
64.4%
British
61.6
/100
|
#162
Good
64.4%
Chickasaw
61.5
/100
|
#163
Good
64.4%
Immigrants | Nigeria
60.1
/100
|
#164
Good
64.4%
Immigrants | Southern Europe
60.0
/100
|
#165
Good
64.4%
Scotch-Irish
59.2
/100
|
#166
Average
64.4%
Irish
57.9
/100
|
#167
Average
64.4%
Hondurans
57.5
/100
|
#168
Average
64.4%
Iraqis
56.0
/100
|
#169
Average
64.4%
Armenians
55.9
/100
|
#170
Average
64.4%

Demographics Similar to Immigrants from Israel by Family Households

In terms of family households, the demographic groups most similar to Immigrants from Israel are Aleut (63.4%, a difference of 0.010%), South African (63.4%, a difference of 0.010%), Immigrants from St. Vincent and the Grenadines (63.4%, a difference of 0.010%), Immigrants from Czechoslovakia (63.4%, a difference of 0.010%), and Immigrants from Zimbabwe (63.5%, a difference of 0.040%).
DemographicsRating | RankFamily Households
Albanians
2.2
/100
|
#235
Tragic
63.5%
Ghanaians
2.1
/100
|
#236
Tragic
63.5%
Comanche
2.1
/100
|
#237
Tragic
63.5%
Immigrants | Zimbabwe
2.0
/100
|
#238
Tragic
63.5%
Aleuts
1.9
/100
|
#239
Tragic
63.4%
South Africans
1.9
/100
|
#240
Tragic
63.4%
Immigrants | St. Vincent and the Grenadines
1.9
/100
|
#241
Tragic
63.4%
Immigrants | Israel
1.8
/100
|
#242
Tragic
63.4%
Immigrants | Czechoslovakia
1.8
/100
|
#243
Tragic
63.4%
Eastern Europeans
1.6
/100
|
#244
Tragic
63.4%
Immigrants | Dominica
1.6
/100
|
#245
Tragic
63.4%
Immigrants | Ghana
1.6
/100
|
#246
Tragic
63.4%
Immigrants | Uzbekistan
1.5
/100
|
#247
Tragic
63.4%
Dominicans
1.5
/100
|
#248
Tragic
63.4%
Russians
1.4
/100
|
#249
Tragic
63.4%