Chickasaw vs Immigrants from Croatia Family Households

COMPARE

Chickasaw
Race
Ancestry
AfghanAfricanAlaska NativeAlaskan AthabascanAlbanianAleutAlsatianAmericanApacheArabArapahoArgentineanArmenianAssyrian/Chaldean/SyriacAustralianAustrianBahamianBangladeshiBarbadianBasqueBelgianBelizeanBermudanBhutaneseBlackfeetBolivianBrazilianBritishBritish West IndianBulgarianBurmeseCajunCambodianCanadianCape VerdeanCarpatho RusynCelticCentral AmericanCentral American IndianCherokeeCheyenneChickasawChileanChineseChippewaChoctawColombianColvilleComancheCosta RicanCreeCreekCroatianCrowCubanCypriotCzechCzechoslovakianDanishDelawareDominicanDutchDutch West IndianEastern EuropeanEcuadorianEgyptianEnglishEstonianEthiopianEuropeanFijianFilipinoFinnishFrenchFrench American IndianFrench CanadianGermanGerman RussianGhanaianGreekGuamanian/ChamorroGuatemalanGuyaneseHaitianHmongHonduranHopiHoumaHungarianIcelanderIndian (Asian)IndonesianInupiatIranianIraqiIrishIroquoisIsraeliItalianJamaicanJapaneseJordanianKenyanKiowaKoreanLaotianLatvianLebaneseLiberianLithuanianLumbeeLuxembourgerMacedonianMalaysianMalteseMarshalleseMenomineeMexicanMexican American IndianMongolianMoroccanNative HawaiianNavajoNepaleseNew ZealanderNicaraguanNigerianNorthern EuropeanNorwegianOkinawanOsageOttawaPaiutePakistaniPalestinianPanamanianParaguayanPennsylvania GermanPeruvianPimaPolishPortuguesePotawatomiPuebloPuerto RicanPuget Sound SalishRomanianRussianSalvadoranSamoanScandinavianScotch-IrishScottishSeminoleSenegaleseSerbianShoshoneSierra LeoneanSiouxSlavicSlovakSloveneSomaliSouth AfricanSouth AmericanSouth American IndianSoviet UnionSpaniardSpanishSpanish AmericanSpanish American IndianSri LankanSubsaharan AfricanSudaneseSwedishSwissSyrianTaiwaneseThaiTlingit-HaidaTohono O'OdhamTonganTrinidadian and TobagonianTsimshianTurkishU.S. Virgin IslanderUgandanUkrainianUruguayanUteVenezuelanVietnameseWelshWest IndianYakamaYaquiYugoslavianYumanYup'ikZimbabwean
Immigration
NonimmigrantsImmigrantsAfghanistanAfricaAlbaniaArgentinaArmeniaAsiaAustraliaAustriaBahamasBangladeshBarbadosBelarusBelgiumBelizeBoliviaBosnia and HerzegovinaBrazilBulgariaBurma/MyanmarCabo VerdeCambodiaCameroonCanadaCaribbeanCentral AmericaChileChinaColombiaCongoCosta RicaCubaCzechoslovakiaDenmarkDominicaDominican RepublicEastern AfricaEastern AsiaEastern EuropeEcuadorEgyptEl SalvadorEnglandEritreaEthiopiaEuropeFijiFranceGermanyGhanaGreeceGrenadaGuatemalaGuyanaHaitiHondurasHong KongHungaryIndiaIndonesiaIranIraqIrelandIsraelItalyJamaicaJapanJordanKazakhstanKenyaKoreaKuwaitLaosLatin AmericaLatviaLebanonLiberiaLithuaniaMalaysiaMexicoMicronesiaMiddle AfricaMoldovaMoroccoNepalNetherlandsNicaraguaNigeriaNorth AmericaNorth MacedoniaNorthern AfricaNorthern EuropeNorwayOceaniaPakistanPanamaPeruPhilippinesPolandPortugalRomaniaRussiaSaudi ArabiaScotlandSenegalSerbiaSierra LeoneSingaporeSomaliaSouth AfricaSouth AmericaSouth Central AsiaSouth Eastern AsiaSouthern EuropeSpainSri LankaSt. Vincent and the GrenadinesSudanSwedenSwitzerlandSyriaTaiwanThailandTrinidad and TobagoTurkeyUgandaUkraineUruguayUzbekistanVenezuelaVietnamWest IndiesWestern AfricaWestern AsiaWestern EuropeYemenZaireZimbabweAzores
Immigrants from Croatia
Race
Ancestry
AfghanAfricanAlaska NativeAlaskan AthabascanAlbanianAleutAlsatianAmericanApacheArabArapahoArgentineanArmenianAssyrian/Chaldean/SyriacAustralianAustrianBahamianBangladeshiBarbadianBasqueBelgianBelizeanBermudanBhutaneseBlackfeetBolivianBrazilianBritishBritish West IndianBulgarianBurmeseCajunCambodianCanadianCape VerdeanCarpatho RusynCelticCentral AmericanCentral American IndianCherokeeCheyenneChileanChineseChippewaChoctawColombianColvilleComancheCosta RicanCreeCreekCroatianCrowCubanCypriotCzechCzechoslovakianDanishDelawareDominicanDutchDutch West IndianEastern EuropeanEcuadorianEgyptianEnglishEstonianEthiopianEuropeanFijianFilipinoFinnishFrenchFrench American IndianFrench CanadianGermanGerman RussianGhanaianGreekGuamanian/ChamorroGuatemalanGuyaneseHaitianHmongHonduranHopiHoumaHungarianIcelanderIndian (Asian)IndonesianInupiatIranianIraqiIrishIroquoisIsraeliItalianJamaicanJapaneseJordanianKenyanKiowaKoreanLaotianLatvianLebaneseLiberianLithuanianLumbeeLuxembourgerMacedonianMalaysianMalteseMarshalleseMenomineeMexicanMexican American IndianMongolianMoroccanNative HawaiianNavajoNepaleseNew ZealanderNicaraguanNigerianNorthern EuropeanNorwegianOkinawanOsageOttawaPaiutePakistaniPalestinianPanamanianParaguayanPennsylvania GermanPeruvianPimaPolishPortuguesePotawatomiPuebloPuerto RicanPuget Sound SalishRomanianRussianSalvadoranSamoanScandinavianScotch-IrishScottishSeminoleSenegaleseSerbianShoshoneSierra LeoneanSiouxSlavicSlovakSloveneSomaliSouth AfricanSouth AmericanSouth American IndianSoviet UnionSpaniardSpanishSpanish AmericanSpanish American IndianSri LankanSubsaharan AfricanSudaneseSwedishSwissSyrianTaiwaneseThaiTlingit-HaidaTohono O'OdhamTonganTrinidadian and TobagonianTsimshianTurkishU.S. Virgin IslanderUgandanUkrainianUruguayanUteVenezuelanVietnameseWelshWest IndianYakamaYaquiYugoslavianYumanYup'ikZimbabwean
Immigration
NonimmigrantsImmigrantsAfghanistanAfricaAlbaniaArgentinaArmeniaAsiaAustraliaAustriaBahamasBangladeshBarbadosBelarusBelgiumBelizeBoliviaBosnia and HerzegovinaBrazilBulgariaBurma/MyanmarCabo VerdeCambodiaCameroonCanadaCaribbeanCentral AmericaChileChinaColombiaCongoCosta RicaCroatiaCubaCzechoslovakiaDenmarkDominicaDominican RepublicEastern AfricaEastern AsiaEastern EuropeEcuadorEgyptEl SalvadorEnglandEritreaEthiopiaEuropeFijiFranceGermanyGhanaGreeceGrenadaGuatemalaGuyanaHaitiHondurasHong KongHungaryIndiaIndonesiaIranIraqIrelandIsraelItalyJamaicaJapanJordanKazakhstanKenyaKoreaKuwaitLaosLatin AmericaLatviaLebanonLiberiaLithuaniaMalaysiaMexicoMicronesiaMiddle AfricaMoldovaMoroccoNepalNetherlandsNicaraguaNigeriaNorth AmericaNorth MacedoniaNorthern AfricaNorthern EuropeNorwayOceaniaPakistanPanamaPeruPhilippinesPolandPortugalRomaniaRussiaSaudi ArabiaScotlandSenegalSerbiaSierra LeoneSingaporeSomaliaSouth AfricaSouth AmericaSouth Central AsiaSouth Eastern AsiaSouthern EuropeSpainSri LankaSt. Vincent and the GrenadinesSudanSwedenSwitzerlandSyriaTaiwanThailandTrinidad and TobagoTurkeyUgandaUkraineUruguayUzbekistanVenezuelaVietnamWest IndiesWestern AfricaWestern AsiaWestern EuropeYemenZaireZimbabweAzores
Family Households
Income
Poverty
Unemployment
Labor Participation
Family Structure
Vehicle Availability
Education Level
Disability

Family Households Comparison

Chickasaw

Immigrants from Croatia

Good
Tragic
64.4%
FAMILY HOUSEHOLDS
61.5/ 100
METRIC RATING
163rd/ 347
METRIC RANK
63.1%
FAMILY HOUSEHOLDS
0.3/ 100
METRIC RATING
271st/ 347
METRIC RANK

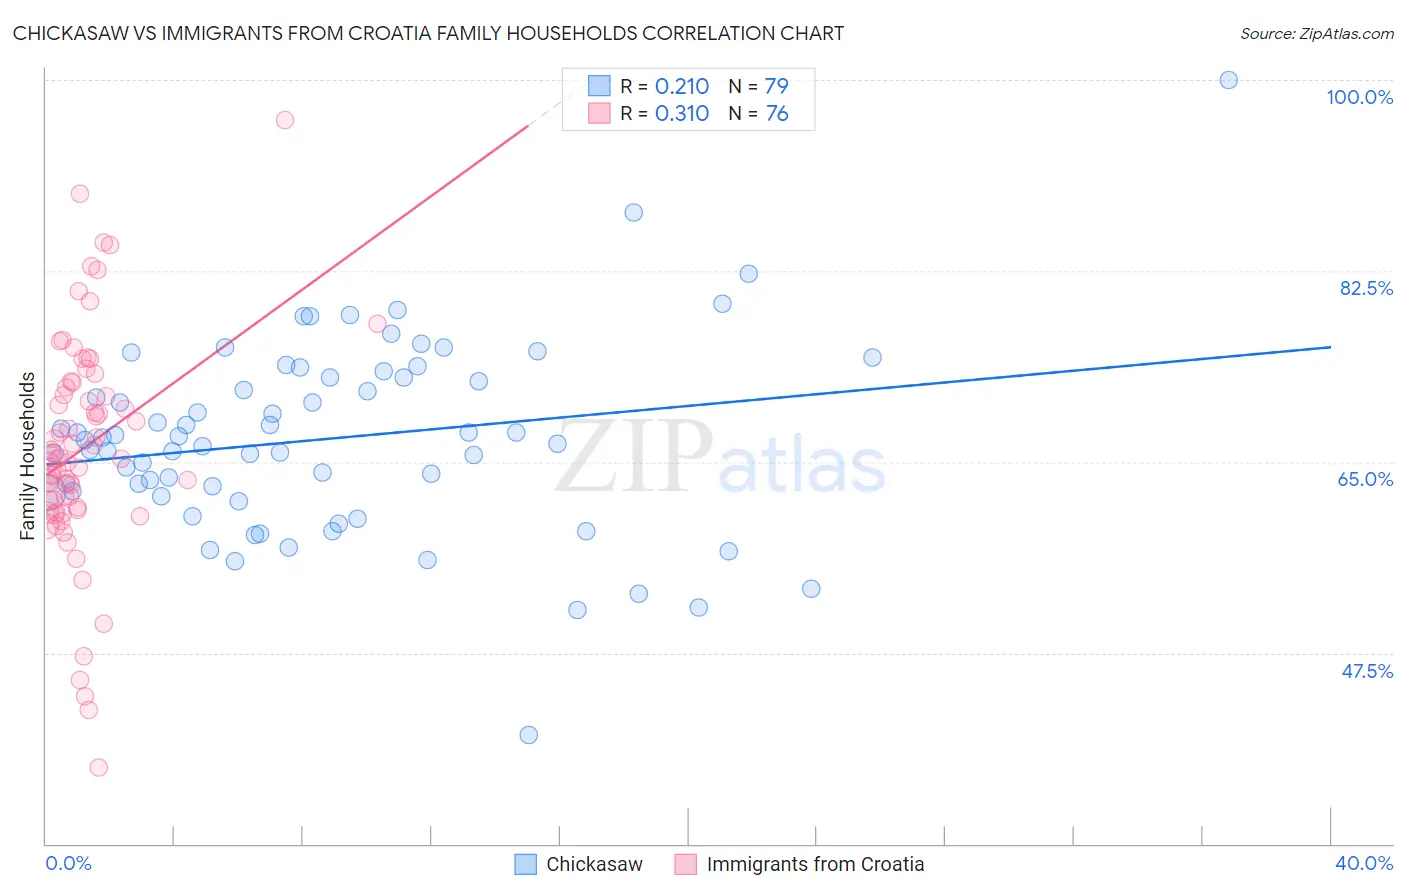
Chickasaw vs Immigrants from Croatia Family Households Correlation Chart

The statistical analysis conducted on geographies consisting of 147,674,365 people shows a weak positive correlation between the proportion of Chickasaw and percentage of family households in the United States with a correlation coefficient (R) of 0.210 and weighted average of 64.4%. Similarly, the statistical analysis conducted on geographies consisting of 132,568,699 people shows a mild positive correlation between the proportion of Immigrants from Croatia and percentage of family households in the United States with a correlation coefficient (R) of 0.310 and weighted average of 63.1%, a difference of 2.1%.
Chickasaw vs Immigrants from Croatia Family Households

Family Households Correlation Summary

MeasurementChickasawImmigrants from Croatia
Minimum40.0%36.9%
Maximum100.0%96.4%
Range60.0%59.4%
Mean67.1%66.3%
Median67.0%65.4%
Interquartile 25% (IQ1)62.2%60.7%
Interquartile 75% (IQ3)72.8%72.1%
Interquartile Range (IQR)10.6%11.4%
Standard Deviation (Sample)8.9%10.3%
Standard Deviation (Population)8.8%10.3%

Similar Demographics by Family Households

Demographics Similar to Chickasaw by Family Households

In terms of family households, the demographic groups most similar to Chickasaw are British (64.4%, a difference of 0.0%), Immigrants from England (64.4%, a difference of 0.020%), Immigrants from Nigeria (64.4%, a difference of 0.020%), Immigrants from Southern Europe (64.4%, a difference of 0.020%), and Scotch-Irish (64.4%, a difference of 0.030%).
DemographicsRating | RankFamily Households
Czechs
67.0
/100
|
#156
Good
64.5%
Canadians
66.6
/100
|
#157
Good
64.4%
Lebanese
66.4
/100
|
#158
Good
64.4%
Germans
65.8
/100
|
#159
Good
64.4%
Immigrants | Moldova
65.2
/100
|
#160
Good
64.4%
Immigrants | England
62.6
/100
|
#161
Good
64.4%
British
61.6
/100
|
#162
Good
64.4%
Chickasaw
61.5
/100
|
#163
Good
64.4%
Immigrants | Nigeria
60.1
/100
|
#164
Good
64.4%
Immigrants | Southern Europe
60.0
/100
|
#165
Good
64.4%
Scotch-Irish
59.2
/100
|
#166
Average
64.4%
Irish
57.9
/100
|
#167
Average
64.4%
Hondurans
57.5
/100
|
#168
Average
64.4%
Iraqis
56.0
/100
|
#169
Average
64.4%
Armenians
55.9
/100
|
#170
Average
64.4%

Demographics Similar to Immigrants from Croatia by Family Households

In terms of family households, the demographic groups most similar to Immigrants from Croatia are Immigrants from Turkey (63.1%, a difference of 0.0%), Immigrants from Austria (63.1%, a difference of 0.010%), Immigrants from Kazakhstan (63.1%, a difference of 0.010%), Lumbee (63.1%, a difference of 0.020%), and West Indian (63.1%, a difference of 0.020%).
DemographicsRating | RankFamily Households
Kenyans
0.5
/100
|
#264
Tragic
63.2%
Colville
0.5
/100
|
#265
Tragic
63.2%
Immigrants | Western Africa
0.5
/100
|
#266
Tragic
63.1%
Israelis
0.4
/100
|
#267
Tragic
63.1%
Immigrants | Singapore
0.4
/100
|
#268
Tragic
63.1%
Yugoslavians
0.4
/100
|
#269
Tragic
63.1%
Immigrants | Austria
0.3
/100
|
#270
Tragic
63.1%
Immigrants | Croatia
0.3
/100
|
#271
Tragic
63.1%
Immigrants | Turkey
0.3
/100
|
#272
Tragic
63.1%
Immigrants | Kazakhstan
0.3
/100
|
#273
Tragic
63.1%
Lumbee
0.3
/100
|
#274
Tragic
63.1%
West Indians
0.3
/100
|
#275
Tragic
63.1%
Serbians
0.3
/100
|
#276
Tragic
63.0%
Ottawa
0.3
/100
|
#277
Tragic
63.0%
Immigrants | Belgium
0.2
/100
|
#278
Tragic
63.0%