Chickasaw vs Somali Family Households

COMPARE

Chickasaw
Race
Ancestry
AfghanAfricanAlaska NativeAlaskan AthabascanAlbanianAleutAlsatianAmericanApacheArabArapahoArgentineanArmenianAssyrian/Chaldean/SyriacAustralianAustrianBahamianBangladeshiBarbadianBasqueBelgianBelizeanBermudanBhutaneseBlackfeetBolivianBrazilianBritishBritish West IndianBulgarianBurmeseCajunCambodianCanadianCape VerdeanCarpatho RusynCelticCentral AmericanCentral American IndianCherokeeCheyenneChickasawChileanChineseChippewaChoctawColombianColvilleComancheCosta RicanCreeCreekCroatianCrowCubanCypriotCzechCzechoslovakianDanishDelawareDominicanDutchDutch West IndianEastern EuropeanEcuadorianEgyptianEnglishEstonianEthiopianEuropeanFijianFilipinoFinnishFrenchFrench American IndianFrench CanadianGermanGerman RussianGhanaianGreekGuamanian/ChamorroGuatemalanGuyaneseHaitianHmongHonduranHopiHoumaHungarianIcelanderIndian (Asian)IndonesianInupiatIranianIraqiIrishIroquoisIsraeliItalianJamaicanJapaneseJordanianKenyanKiowaKoreanLaotianLatvianLebaneseLiberianLithuanianLumbeeLuxembourgerMacedonianMalaysianMalteseMarshalleseMenomineeMexicanMexican American IndianMongolianMoroccanNative HawaiianNavajoNepaleseNew ZealanderNicaraguanNigerianNorthern EuropeanNorwegianOkinawanOsageOttawaPaiutePakistaniPalestinianPanamanianParaguayanPennsylvania GermanPeruvianPimaPolishPortuguesePotawatomiPuebloPuerto RicanPuget Sound SalishRomanianRussianSalvadoranSamoanScandinavianScotch-IrishScottishSeminoleSenegaleseSerbianShoshoneSierra LeoneanSiouxSlavicSlovakSloveneSouth AfricanSouth AmericanSouth American IndianSoviet UnionSpaniardSpanishSpanish AmericanSpanish American IndianSri LankanSubsaharan AfricanSudaneseSwedishSwissSyrianTaiwaneseThaiTlingit-HaidaTohono O'OdhamTonganTrinidadian and TobagonianTsimshianTurkishU.S. Virgin IslanderUgandanUkrainianUruguayanUteVenezuelanVietnameseWelshWest IndianYakamaYaquiYugoslavianYumanYup'ikZimbabwean
Immigration
NonimmigrantsImmigrantsAfghanistanAfricaAlbaniaArgentinaArmeniaAsiaAustraliaAustriaBahamasBangladeshBarbadosBelarusBelgiumBelizeBoliviaBosnia and HerzegovinaBrazilBulgariaBurma/MyanmarCabo VerdeCambodiaCameroonCanadaCaribbeanCentral AmericaChileChinaColombiaCongoCosta RicaCroatiaCubaCzechoslovakiaDenmarkDominicaDominican RepublicEastern AfricaEastern AsiaEastern EuropeEcuadorEgyptEl SalvadorEnglandEritreaEthiopiaEuropeFijiFranceGermanyGhanaGreeceGrenadaGuatemalaGuyanaHaitiHondurasHong KongHungaryIndiaIndonesiaIranIraqIrelandIsraelItalyJamaicaJapanJordanKazakhstanKenyaKoreaKuwaitLaosLatin AmericaLatviaLebanonLiberiaLithuaniaMalaysiaMexicoMicronesiaMiddle AfricaMoldovaMoroccoNepalNetherlandsNicaraguaNigeriaNorth AmericaNorth MacedoniaNorthern AfricaNorthern EuropeNorwayOceaniaPakistanPanamaPeruPhilippinesPolandPortugalRomaniaRussiaSaudi ArabiaScotlandSenegalSerbiaSierra LeoneSingaporeSomaliaSouth AfricaSouth AmericaSouth Central AsiaSouth Eastern AsiaSouthern EuropeSpainSri LankaSt. Vincent and the GrenadinesSudanSwedenSwitzerlandSyriaTaiwanThailandTrinidad and TobagoTurkeyUgandaUkraineUruguayUzbekistanVenezuelaVietnamWest IndiesWestern AfricaWestern AsiaWestern EuropeYemenZaireZimbabweAzores
Somali
Race
Ancestry
AfghanAfricanAlaska NativeAlaskan AthabascanAlbanianAleutAlsatianAmericanApacheArabArapahoArgentineanArmenianAssyrian/Chaldean/SyriacAustralianAustrianBahamianBangladeshiBarbadianBasqueBelgianBelizeanBermudanBhutaneseBlackfeetBolivianBrazilianBritishBritish West IndianBulgarianBurmeseCajunCambodianCanadianCape VerdeanCarpatho RusynCelticCentral AmericanCentral American IndianCherokeeCheyenneChileanChineseChippewaChoctawColombianColvilleComancheCosta RicanCreeCreekCroatianCrowCubanCypriotCzechCzechoslovakianDanishDelawareDominicanDutchDutch West IndianEastern EuropeanEcuadorianEgyptianEnglishEstonianEthiopianEuropeanFijianFilipinoFinnishFrenchFrench American IndianFrench CanadianGermanGerman RussianGhanaianGreekGuamanian/ChamorroGuatemalanGuyaneseHaitianHmongHonduranHopiHoumaHungarianIcelanderIndian (Asian)IndonesianInupiatIranianIraqiIrishIroquoisIsraeliItalianJamaicanJapaneseJordanianKenyanKiowaKoreanLaotianLatvianLebaneseLiberianLithuanianLumbeeLuxembourgerMacedonianMalaysianMalteseMarshalleseMenomineeMexicanMexican American IndianMongolianMoroccanNative HawaiianNavajoNepaleseNew ZealanderNicaraguanNigerianNorthern EuropeanNorwegianOkinawanOsageOttawaPaiutePakistaniPalestinianPanamanianParaguayanPennsylvania GermanPeruvianPimaPolishPortuguesePotawatomiPuebloPuerto RicanPuget Sound SalishRomanianRussianSalvadoranSamoanScandinavianScotch-IrishScottishSeminoleSenegaleseSerbianShoshoneSierra LeoneanSiouxSlavicSlovakSloveneSomaliSouth AfricanSouth AmericanSouth American IndianSoviet UnionSpaniardSpanishSpanish AmericanSpanish American IndianSri LankanSubsaharan AfricanSudaneseSwedishSwissSyrianTaiwaneseThaiTlingit-HaidaTohono O'OdhamTonganTrinidadian and TobagonianTsimshianTurkishU.S. Virgin IslanderUgandanUkrainianUruguayanUteVenezuelanVietnameseWelshWest IndianYakamaYaquiYugoslavianYumanYup'ikZimbabwean
Immigration
NonimmigrantsImmigrantsAfghanistanAfricaAlbaniaArgentinaArmeniaAsiaAustraliaAustriaBahamasBangladeshBarbadosBelarusBelgiumBelizeBoliviaBosnia and HerzegovinaBrazilBulgariaBurma/MyanmarCabo VerdeCambodiaCameroonCanadaCaribbeanCentral AmericaChileChinaColombiaCongoCosta RicaCroatiaCubaCzechoslovakiaDenmarkDominicaDominican RepublicEastern AfricaEastern AsiaEastern EuropeEcuadorEgyptEl SalvadorEnglandEritreaEthiopiaEuropeFijiFranceGermanyGhanaGreeceGrenadaGuatemalaGuyanaHaitiHondurasHong KongHungaryIndiaIndonesiaIranIraqIrelandIsraelItalyJamaicaJapanJordanKazakhstanKenyaKoreaKuwaitLaosLatin AmericaLatviaLebanonLiberiaLithuaniaMalaysiaMexicoMicronesiaMiddle AfricaMoldovaMoroccoNepalNetherlandsNicaraguaNigeriaNorth AmericaNorth MacedoniaNorthern AfricaNorthern EuropeNorwayOceaniaPakistanPanamaPeruPhilippinesPolandPortugalRomaniaRussiaSaudi ArabiaScotlandSenegalSerbiaSierra LeoneSingaporeSomaliaSouth AfricaSouth AmericaSouth Central AsiaSouth Eastern AsiaSouthern EuropeSpainSri LankaSt. Vincent and the GrenadinesSudanSwedenSwitzerlandSyriaTaiwanThailandTrinidad and TobagoTurkeyUgandaUkraineUruguayUzbekistanVenezuelaVietnamWest IndiesWestern AfricaWestern AsiaWestern EuropeYemenZaireZimbabweAzores
Family Households
Income
Poverty
Unemployment
Labor Participation
Family Structure
Vehicle Availability
Education Level
Disability

Family Households Comparison

Chickasaw

Somalis

Good
Tragic
64.4%
FAMILY HOUSEHOLDS
61.5/ 100
METRIC RATING
163rd/ 347
METRIC RANK
57.6%
FAMILY HOUSEHOLDS
0.0/ 100
METRIC RATING
346th/ 347
METRIC RANK

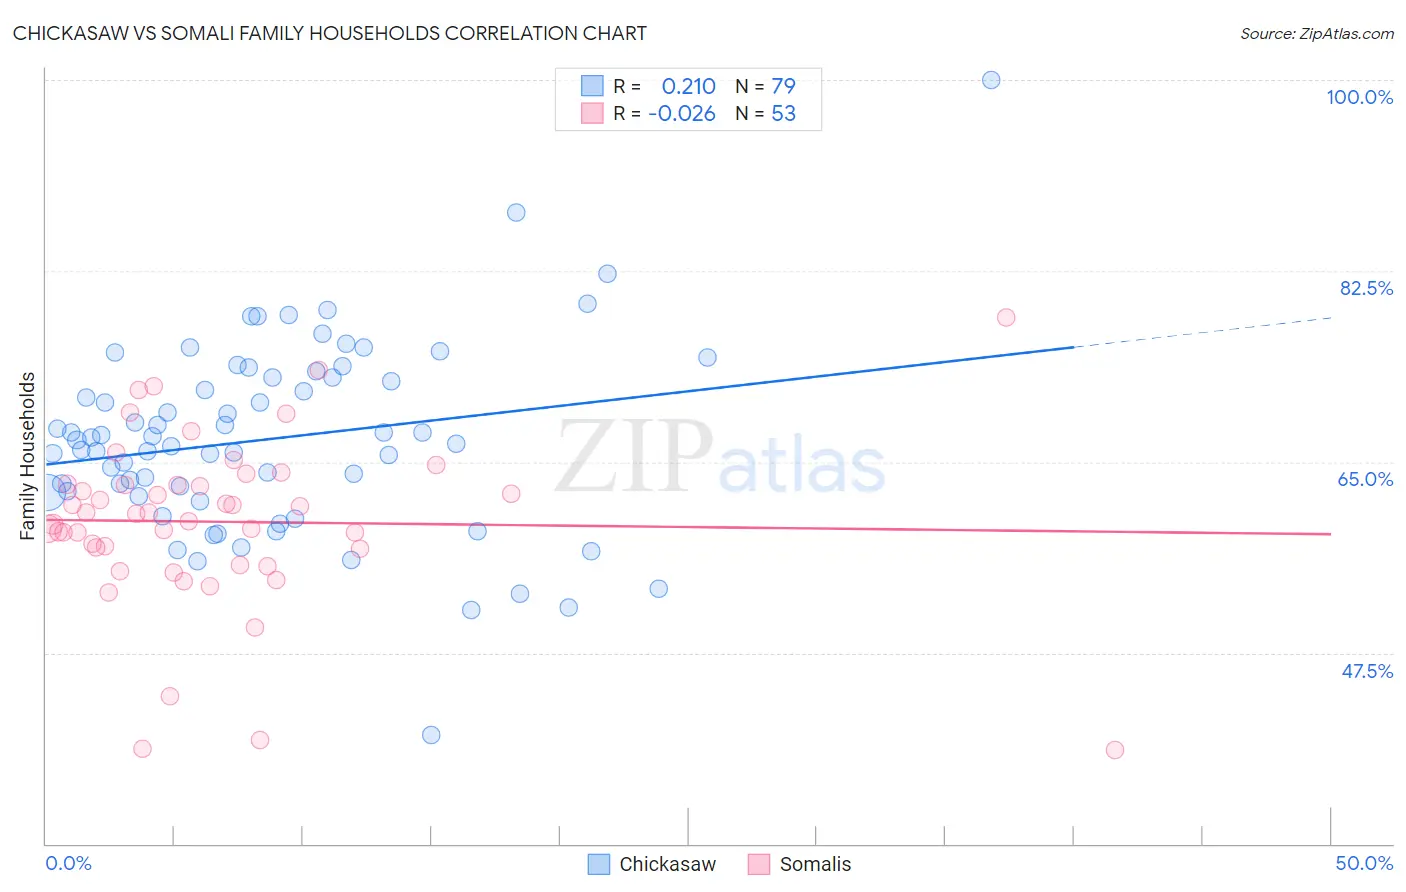
Chickasaw vs Somali Family Households Correlation Chart

The statistical analysis conducted on geographies consisting of 147,674,365 people shows a weak positive correlation between the proportion of Chickasaw and percentage of family households in the United States with a correlation coefficient (R) of 0.210 and weighted average of 64.4%. Similarly, the statistical analysis conducted on geographies consisting of 99,263,237 people shows no correlation between the proportion of Somalis and percentage of family households in the United States with a correlation coefficient (R) of -0.026 and weighted average of 57.6%, a difference of 11.7%.
Chickasaw vs Somali Family Households

Family Households Correlation Summary

MeasurementChickasawSomali
Minimum40.0%38.6%
Maximum100.0%78.2%
Range60.0%39.6%
Mean67.1%59.5%
Median67.0%60.2%
Interquartile 25% (IQ1)62.2%56.3%
Interquartile 75% (IQ3)72.8%62.9%
Interquartile Range (IQR)10.6%6.6%
Standard Deviation (Sample)8.9%7.8%
Standard Deviation (Population)8.8%7.8%

Similar Demographics by Family Households

Demographics Similar to Chickasaw by Family Households

In terms of family households, the demographic groups most similar to Chickasaw are British (64.4%, a difference of 0.0%), Immigrants from England (64.4%, a difference of 0.020%), Immigrants from Nigeria (64.4%, a difference of 0.020%), Immigrants from Southern Europe (64.4%, a difference of 0.020%), and Scotch-Irish (64.4%, a difference of 0.030%).
DemographicsRating | RankFamily Households
Czechs
67.0
/100
|
#156
Good
64.5%
Canadians
66.6
/100
|
#157
Good
64.4%
Lebanese
66.4
/100
|
#158
Good
64.4%
Germans
65.8
/100
|
#159
Good
64.4%
Immigrants | Moldova
65.2
/100
|
#160
Good
64.4%
Immigrants | England
62.6
/100
|
#161
Good
64.4%
British
61.6
/100
|
#162
Good
64.4%
Chickasaw
61.5
/100
|
#163
Good
64.4%
Immigrants | Nigeria
60.1
/100
|
#164
Good
64.4%
Immigrants | Southern Europe
60.0
/100
|
#165
Good
64.4%
Scotch-Irish
59.2
/100
|
#166
Average
64.4%
Irish
57.9
/100
|
#167
Average
64.4%
Hondurans
57.5
/100
|
#168
Average
64.4%
Iraqis
56.0
/100
|
#169
Average
64.4%
Armenians
55.9
/100
|
#170
Average
64.4%

Demographics Similar to Somalis by Family Households

In terms of family households, the demographic groups most similar to Somalis are Immigrants from Somalia (56.7%, a difference of 1.7%), Immigrants from Zaire (59.2%, a difference of 2.6%), Immigrants from Congo (59.2%, a difference of 2.8%), Senegalese (59.8%, a difference of 3.8%), and Sudanese (60.0%, a difference of 4.1%).
DemographicsRating | RankFamily Households
Immigrants | Ethiopia
0.0
/100
|
#333
Tragic
61.2%
Immigrants | Eastern Africa
0.0
/100
|
#334
Tragic
61.1%
Carpatho Rusyns
0.0
/100
|
#335
Tragic
61.1%
German Russians
0.0
/100
|
#336
Tragic
60.9%
Soviet Union
0.0
/100
|
#337
Tragic
60.9%
Immigrants | Eritrea
0.0
/100
|
#338
Tragic
60.8%
Immigrants | Saudi Arabia
0.0
/100
|
#339
Tragic
60.7%
Immigrants | Sudan
0.0
/100
|
#340
Tragic
60.2%
Immigrants | Senegal
0.0
/100
|
#341
Tragic
60.1%
Sudanese
0.0
/100
|
#342
Tragic
60.0%
Senegalese
0.0
/100
|
#343
Tragic
59.8%
Immigrants | Congo
0.0
/100
|
#344
Tragic
59.2%
Immigrants | Zaire
0.0
/100
|
#345
Tragic
59.2%
Somalis
0.0
/100
|
#346
Tragic
57.6%
Immigrants | Somalia
0.0
/100
|
#347
Tragic
56.7%