Indian (Asian) vs Immigrants from South America GED/Equivalency
COMPARE
Indian (Asian)
Immigrants from South America
GED/Equivalency
GED/Equivalency Comparison
Indians (Asian)
Immigrants from South America
87.1%
GED/EQUIVALENCY
95.9/ 100
METRIC RATING
105th/ 347
METRIC RANK
84.4%
GED/EQUIVALENCY
4.2/ 100
METRIC RATING
232nd/ 347
METRIC RANK
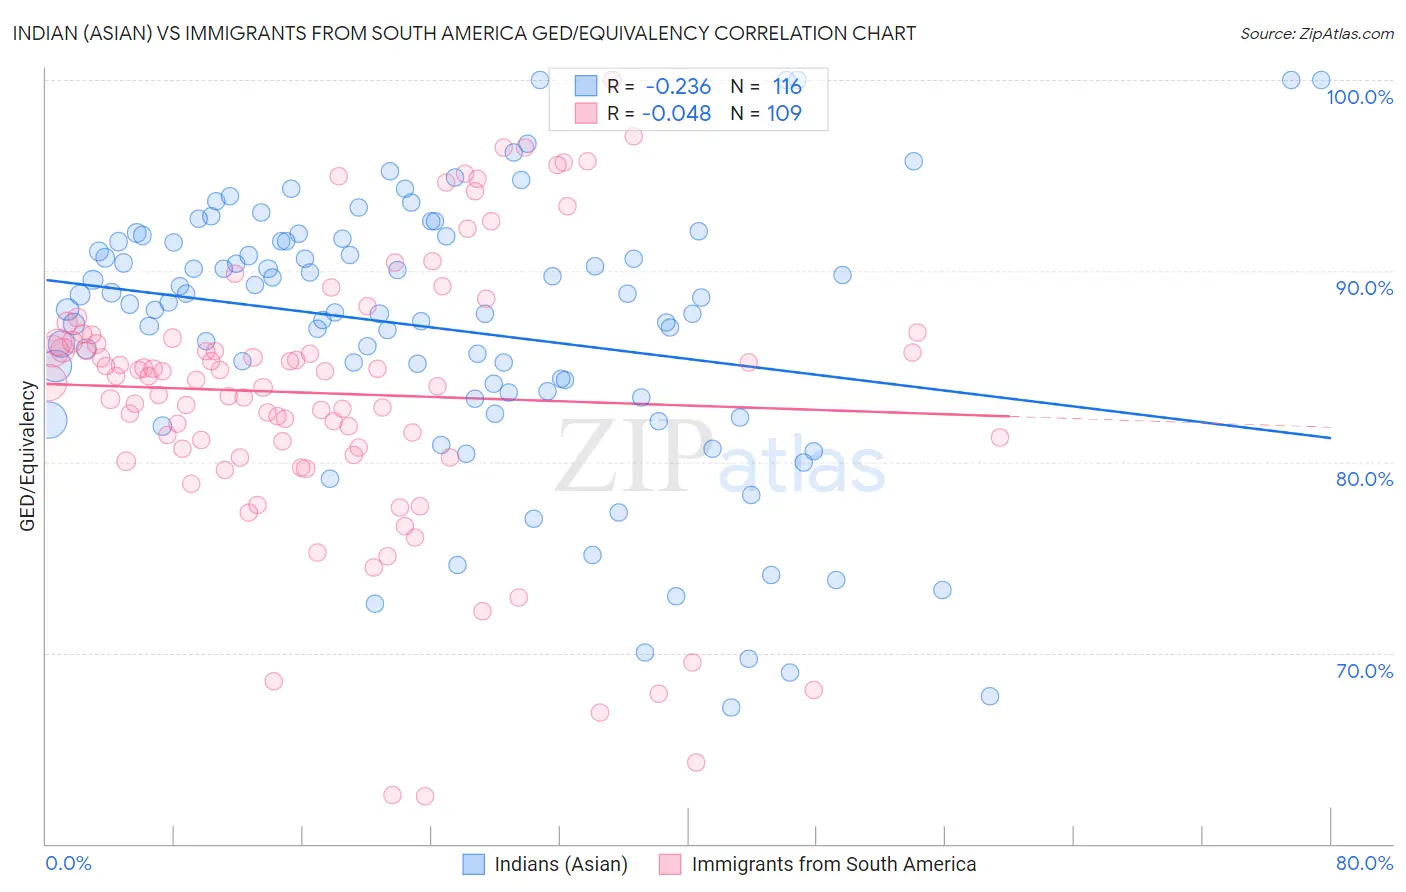
Indian (Asian) vs Immigrants from South America GED/Equivalency Correlation Chart
The statistical analysis conducted on geographies consisting of 495,347,994 people shows a weak negative correlation between the proportion of Indians (Asian) and percentage of population with at least ged/equivalency education in the United States with a correlation coefficient (R) of -0.236 and weighted average of 87.1%. Similarly, the statistical analysis conducted on geographies consisting of 486,429,793 people shows no correlation between the proportion of Immigrants from South America and percentage of population with at least ged/equivalency education in the United States with a correlation coefficient (R) of -0.048 and weighted average of 84.4%, a difference of 3.3%.
GED/Equivalency Correlation Summary
| Measurement | Indian (Asian) | Immigrants from South America |
| Minimum | 67.1% | 62.5% |
| Maximum | 100.0% | 100.0% |
| Range | 32.9% | 37.5% |
| Mean | 87.0% | 83.6% |
| Median | 88.3% | 84.5% |
| Interquartile 25% (IQ1) | 83.7% | 80.5% |
| Interquartile 75% (IQ3) | 91.6% | 86.6% |
| Interquartile Range (IQR) | 7.9% | 6.0% |
| Standard Deviation (Sample) | 7.1% | 7.4% |
| Standard Deviation (Population) | 7.1% | 7.3% |
Similar Demographics by GED/Equivalency
Demographics Similar to Indians (Asian) by GED/Equivalency
In terms of ged/equivalency, the demographic groups most similar to Indians (Asian) are Immigrants from Hungary (87.2%, a difference of 0.010%), Jordanian (87.2%, a difference of 0.020%), Immigrants from Zimbabwe (87.1%, a difference of 0.020%), Icelander (87.1%, a difference of 0.020%), and Lebanese (87.2%, a difference of 0.030%).
| Demographics | Rating | Rank | GED/Equivalency |
| Immigrants | Croatia | 96.9 /100 | #98 | Exceptional 87.3% |
| Immigrants | Belarus | 96.9 /100 | #99 | Exceptional 87.3% |
| Palestinians | 96.8 /100 | #100 | Exceptional 87.3% |
| Syrians | 96.6 /100 | #101 | Exceptional 87.2% |
| Lebanese | 96.2 /100 | #102 | Exceptional 87.2% |
| Jordanians | 96.1 /100 | #103 | Exceptional 87.2% |
| Immigrants | Hungary | 96.0 /100 | #104 | Exceptional 87.2% |
| Indians (Asian) | 95.9 /100 | #105 | Exceptional 87.1% |
| Immigrants | Zimbabwe | 95.8 /100 | #106 | Exceptional 87.1% |
| Icelanders | 95.7 /100 | #107 | Exceptional 87.1% |
| Canadians | 95.6 /100 | #108 | Exceptional 87.1% |
| Immigrants | Eastern Europe | 95.5 /100 | #109 | Exceptional 87.1% |
| Egyptians | 95.3 /100 | #110 | Exceptional 87.1% |
| French | 95.2 /100 | #111 | Exceptional 87.1% |
| Tlingit-Haida | 94.8 /100 | #112 | Exceptional 87.0% |
Demographics Similar to Immigrants from South America by GED/Equivalency
In terms of ged/equivalency, the demographic groups most similar to Immigrants from South America are Immigrants from Panama (84.4%, a difference of 0.010%), Immigrants from Middle Africa (84.4%, a difference of 0.020%), Immigrants from Colombia (84.4%, a difference of 0.040%), Immigrants from Uruguay (84.4%, a difference of 0.050%), and Immigrants from Nigeria (84.3%, a difference of 0.080%).
| Demographics | Rating | Rank | GED/Equivalency |
| Immigrants | Thailand | 5.8 /100 | #225 | Tragic 84.5% |
| Immigrants | Zaire | 5.5 /100 | #226 | Tragic 84.5% |
| Immigrants | Costa Rica | 5.4 /100 | #227 | Tragic 84.5% |
| Immigrants | Liberia | 4.9 /100 | #228 | Tragic 84.4% |
| Immigrants | Uruguay | 4.6 /100 | #229 | Tragic 84.4% |
| Immigrants | Colombia | 4.5 /100 | #230 | Tragic 84.4% |
| Immigrants | Middle Africa | 4.3 /100 | #231 | Tragic 84.4% |
| Immigrants | South America | 4.2 /100 | #232 | Tragic 84.4% |
| Immigrants | Panama | 4.1 /100 | #233 | Tragic 84.4% |
| Immigrants | Nigeria | 3.6 /100 | #234 | Tragic 84.3% |
| Ghanaians | 3.5 /100 | #235 | Tragic 84.3% |
| Immigrants | Eritrea | 3.5 /100 | #236 | Tragic 84.3% |
| Sub-Saharan Africans | 3.0 /100 | #237 | Tragic 84.2% |
| Immigrants | Peru | 2.7 /100 | #238 | Tragic 84.2% |
| Immigrants | Bahamas | 2.6 /100 | #239 | Tragic 84.2% |