Costa Rican vs Immigrants from South America GED/Equivalency
COMPARE
Costa Rican
Immigrants from South America
GED/Equivalency
GED/Equivalency Comparison
Costa Ricans
Immigrants from South America
85.2%
GED/EQUIVALENCY
20.4/ 100
METRIC RATING
197th/ 347
METRIC RANK
84.4%
GED/EQUIVALENCY
4.2/ 100
METRIC RATING
232nd/ 347
METRIC RANK
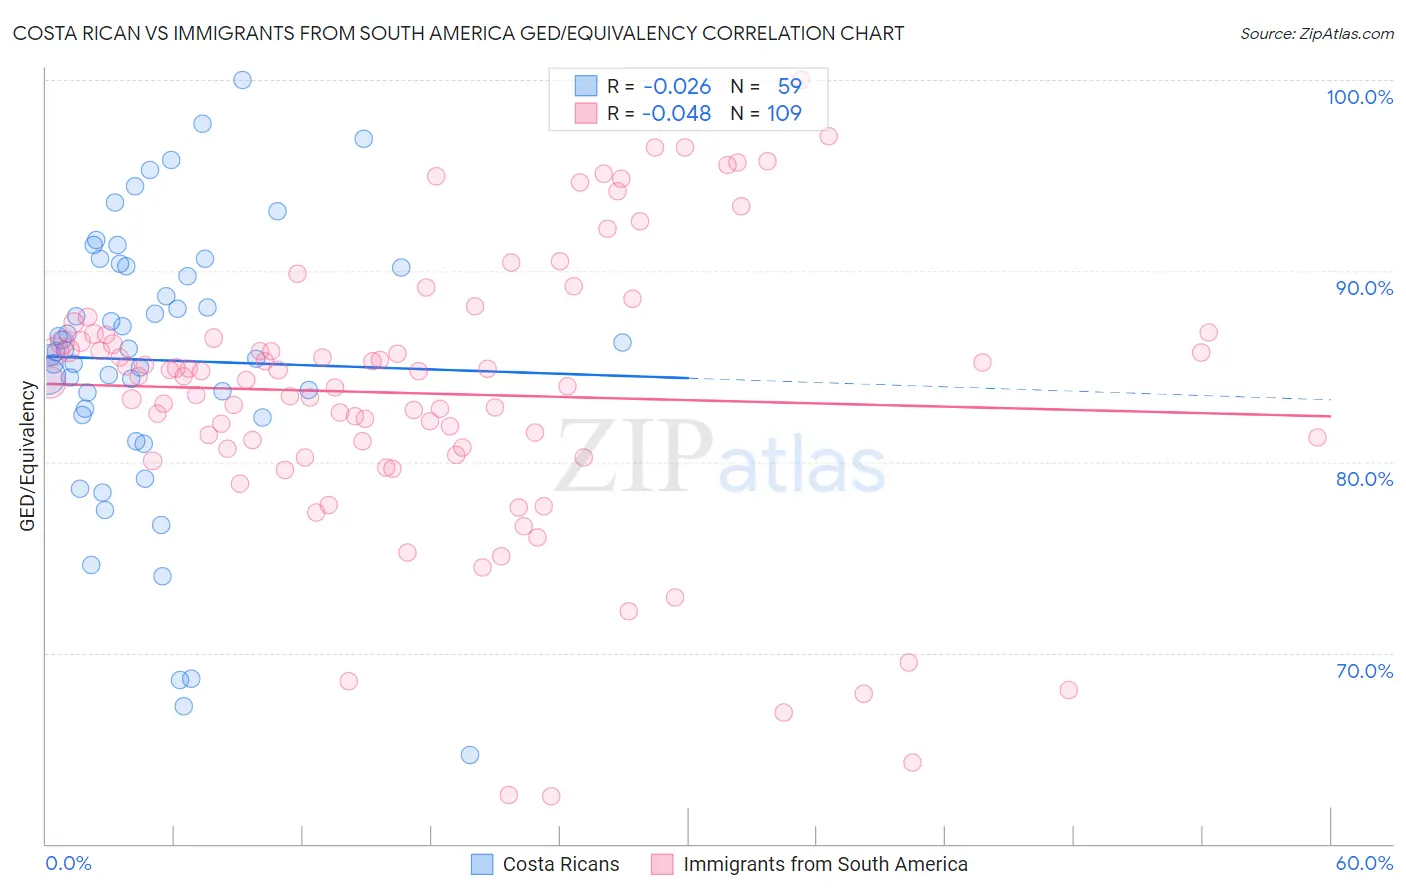
Costa Rican vs Immigrants from South America GED/Equivalency Correlation Chart
The statistical analysis conducted on geographies consisting of 253,601,897 people shows no correlation between the proportion of Costa Ricans and percentage of population with at least ged/equivalency education in the United States with a correlation coefficient (R) of -0.026 and weighted average of 85.2%. Similarly, the statistical analysis conducted on geographies consisting of 486,429,793 people shows no correlation between the proportion of Immigrants from South America and percentage of population with at least ged/equivalency education in the United States with a correlation coefficient (R) of -0.048 and weighted average of 84.4%, a difference of 0.92%.
GED/Equivalency Correlation Summary
| Measurement | Costa Rican | Immigrants from South America |
| Minimum | 64.7% | 62.5% |
| Maximum | 100.0% | 100.0% |
| Range | 35.3% | 37.5% |
| Mean | 85.3% | 83.6% |
| Median | 85.9% | 84.5% |
| Interquartile 25% (IQ1) | 82.5% | 80.5% |
| Interquartile 75% (IQ3) | 90.3% | 86.6% |
| Interquartile Range (IQR) | 7.8% | 6.0% |
| Standard Deviation (Sample) | 7.3% | 7.4% |
| Standard Deviation (Population) | 7.3% | 7.3% |
Similar Demographics by GED/Equivalency
Demographics Similar to Costa Ricans by GED/Equivalency
In terms of ged/equivalency, the demographic groups most similar to Costa Ricans are Puget Sound Salish (85.2%, a difference of 0.010%), Chippewa (85.2%, a difference of 0.010%), Tongan (85.2%, a difference of 0.010%), Delaware (85.2%, a difference of 0.060%), and South American Indian (85.2%, a difference of 0.070%).
| Demographics | Rating | Rank | GED/Equivalency |
| Alaskan Athabascans | 27.5 /100 | #190 | Fair 85.3% |
| South American Indians | 22.8 /100 | #191 | Fair 85.2% |
| Immigrants | Nonimmigrants | 22.7 /100 | #192 | Fair 85.2% |
| Delaware | 22.2 /100 | #193 | Fair 85.2% |
| Puget Sound Salish | 20.8 /100 | #194 | Fair 85.2% |
| Chippewa | 20.8 /100 | #195 | Fair 85.2% |
| Tongans | 20.7 /100 | #196 | Fair 85.2% |
| Costa Ricans | 20.4 /100 | #197 | Fair 85.2% |
| Immigrants | Africa | 17.5 /100 | #198 | Poor 85.1% |
| Somalis | 16.4 /100 | #199 | Poor 85.0% |
| Uruguayans | 16.0 /100 | #200 | Poor 85.0% |
| Portuguese | 15.9 /100 | #201 | Poor 85.0% |
| Cree | 15.9 /100 | #202 | Poor 85.0% |
| Panamanians | 15.3 /100 | #203 | Poor 85.0% |
| Hawaiians | 15.2 /100 | #204 | Poor 85.0% |
Demographics Similar to Immigrants from South America by GED/Equivalency
In terms of ged/equivalency, the demographic groups most similar to Immigrants from South America are Immigrants from Panama (84.4%, a difference of 0.010%), Immigrants from Middle Africa (84.4%, a difference of 0.020%), Immigrants from Colombia (84.4%, a difference of 0.040%), Immigrants from Uruguay (84.4%, a difference of 0.050%), and Immigrants from Nigeria (84.3%, a difference of 0.080%).
| Demographics | Rating | Rank | GED/Equivalency |
| Immigrants | Thailand | 5.8 /100 | #225 | Tragic 84.5% |
| Immigrants | Zaire | 5.5 /100 | #226 | Tragic 84.5% |
| Immigrants | Costa Rica | 5.4 /100 | #227 | Tragic 84.5% |
| Immigrants | Liberia | 4.9 /100 | #228 | Tragic 84.4% |
| Immigrants | Uruguay | 4.6 /100 | #229 | Tragic 84.4% |
| Immigrants | Colombia | 4.5 /100 | #230 | Tragic 84.4% |
| Immigrants | Middle Africa | 4.3 /100 | #231 | Tragic 84.4% |
| Immigrants | South America | 4.2 /100 | #232 | Tragic 84.4% |
| Immigrants | Panama | 4.1 /100 | #233 | Tragic 84.4% |
| Immigrants | Nigeria | 3.6 /100 | #234 | Tragic 84.3% |
| Ghanaians | 3.5 /100 | #235 | Tragic 84.3% |
| Immigrants | Eritrea | 3.5 /100 | #236 | Tragic 84.3% |
| Sub-Saharan Africans | 3.0 /100 | #237 | Tragic 84.2% |
| Immigrants | Peru | 2.7 /100 | #238 | Tragic 84.2% |
| Immigrants | Bahamas | 2.6 /100 | #239 | Tragic 84.2% |