Immigrants from Middle Africa vs Immigrants from South America GED/Equivalency
COMPARE
Immigrants from Middle Africa
Immigrants from South America
GED/Equivalency
GED/Equivalency Comparison
Immigrants from Middle Africa
Immigrants from South America
84.4%
GED/EQUIVALENCY
4.3/ 100
METRIC RATING
231st/ 347
METRIC RANK
84.4%
GED/EQUIVALENCY
4.2/ 100
METRIC RATING
232nd/ 347
METRIC RANK
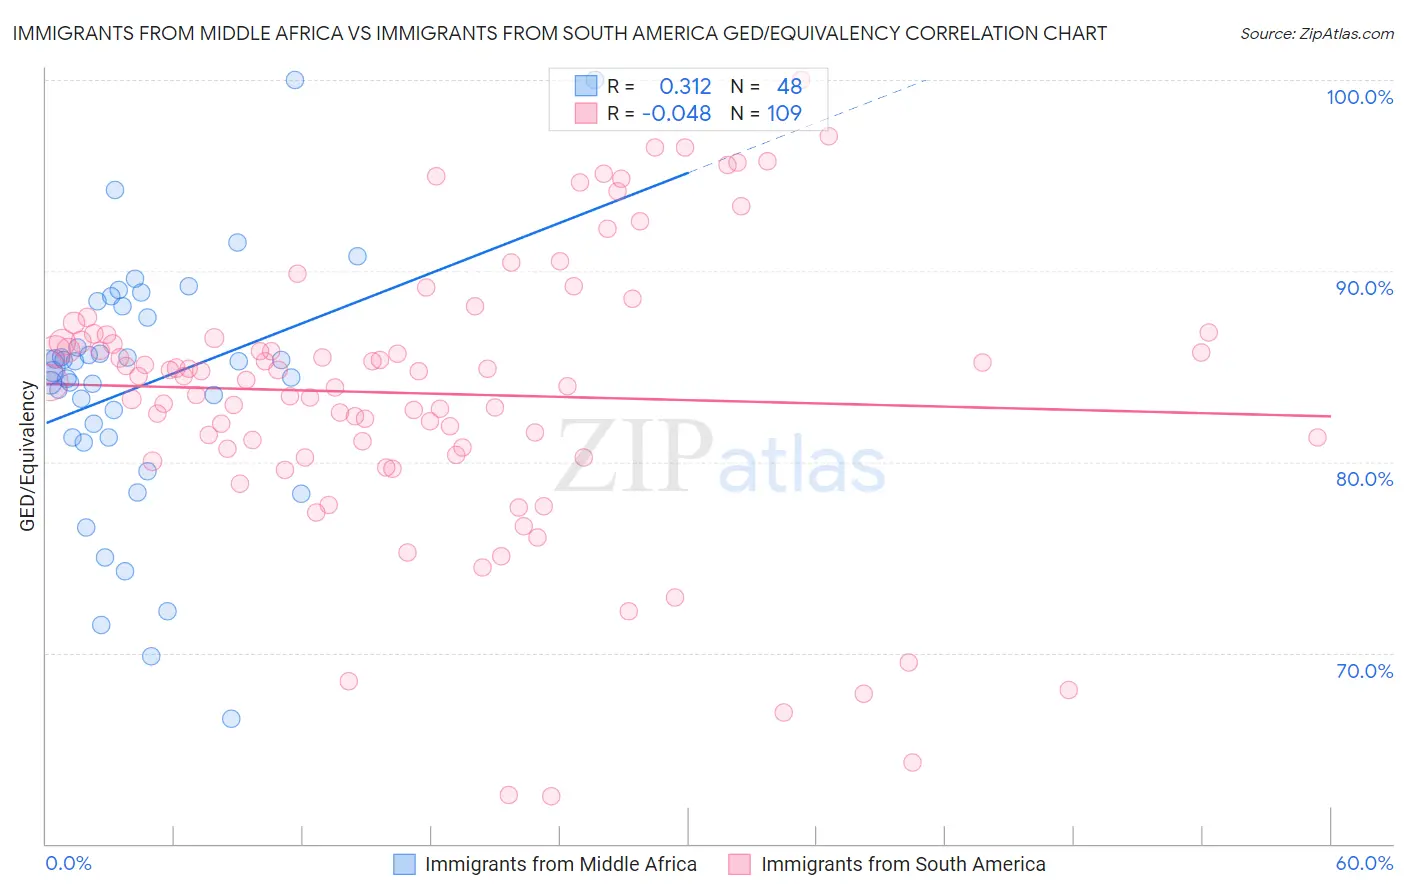
Immigrants from Middle Africa vs Immigrants from South America GED/Equivalency Correlation Chart
The statistical analysis conducted on geographies consisting of 202,748,536 people shows a mild positive correlation between the proportion of Immigrants from Middle Africa and percentage of population with at least ged/equivalency education in the United States with a correlation coefficient (R) of 0.312 and weighted average of 84.4%. Similarly, the statistical analysis conducted on geographies consisting of 486,429,793 people shows no correlation between the proportion of Immigrants from South America and percentage of population with at least ged/equivalency education in the United States with a correlation coefficient (R) of -0.048 and weighted average of 84.4%, a difference of 0.020%.
GED/Equivalency Correlation Summary
| Measurement | Immigrants from Middle Africa | Immigrants from South America |
| Minimum | 66.6% | 62.5% |
| Maximum | 100.0% | 100.0% |
| Range | 33.4% | 37.5% |
| Mean | 84.0% | 83.6% |
| Median | 84.8% | 84.5% |
| Interquartile 25% (IQ1) | 81.3% | 80.5% |
| Interquartile 75% (IQ3) | 87.9% | 86.6% |
| Interquartile Range (IQR) | 6.6% | 6.0% |
| Standard Deviation (Sample) | 6.6% | 7.4% |
| Standard Deviation (Population) | 6.6% | 7.3% |
Demographics Similar to Immigrants from Middle Africa and Immigrants from South America by GED/Equivalency
In terms of ged/equivalency, the demographic groups most similar to Immigrants from Middle Africa are Immigrants from Uruguay (84.4%, a difference of 0.030%), Immigrants from Colombia (84.4%, a difference of 0.030%), Immigrants from Panama (84.4%, a difference of 0.030%), Immigrants from Liberia (84.4%, a difference of 0.070%), and Immigrants from Nigeria (84.3%, a difference of 0.10%). Similarly, the demographic groups most similar to Immigrants from South America are Immigrants from Panama (84.4%, a difference of 0.010%), Immigrants from Colombia (84.4%, a difference of 0.040%), Immigrants from Uruguay (84.4%, a difference of 0.050%), Immigrants from Nigeria (84.3%, a difference of 0.080%), and Immigrants from Liberia (84.4%, a difference of 0.090%).
| Demographics | Rating | Rank | GED/Equivalency |
| Taiwanese | 8.1 /100 | #221 | Tragic 84.7% |
| Iroquois | 7.5 /100 | #222 | Tragic 84.6% |
| Immigrants | Uzbekistan | 7.1 /100 | #223 | Tragic 84.6% |
| French American Indians | 6.3 /100 | #224 | Tragic 84.6% |
| Immigrants | Thailand | 5.8 /100 | #225 | Tragic 84.5% |
| Immigrants | Zaire | 5.5 /100 | #226 | Tragic 84.5% |
| Immigrants | Costa Rica | 5.4 /100 | #227 | Tragic 84.5% |
| Immigrants | Liberia | 4.9 /100 | #228 | Tragic 84.4% |
| Immigrants | Uruguay | 4.6 /100 | #229 | Tragic 84.4% |
| Immigrants | Colombia | 4.5 /100 | #230 | Tragic 84.4% |
| Immigrants | Middle Africa | 4.3 /100 | #231 | Tragic 84.4% |
| Immigrants | South America | 4.2 /100 | #232 | Tragic 84.4% |
| Immigrants | Panama | 4.1 /100 | #233 | Tragic 84.4% |
| Immigrants | Nigeria | 3.6 /100 | #234 | Tragic 84.3% |
| Ghanaians | 3.5 /100 | #235 | Tragic 84.3% |
| Immigrants | Eritrea | 3.5 /100 | #236 | Tragic 84.3% |
| Sub-Saharan Africans | 3.0 /100 | #237 | Tragic 84.2% |
| Immigrants | Peru | 2.7 /100 | #238 | Tragic 84.2% |
| Immigrants | Bahamas | 2.6 /100 | #239 | Tragic 84.2% |
| Immigrants | South Eastern Asia | 2.5 /100 | #240 | Tragic 84.1% |
| Senegalese | 1.9 /100 | #241 | Tragic 84.0% |