Immigrants from Western Europe vs Tlingit-Haida GED/Equivalency
COMPARE
Immigrants from Western Europe
Tlingit-Haida
GED/Equivalency
GED/Equivalency Comparison
Immigrants from Western Europe
Tlingit-Haida
87.3%
GED/EQUIVALENCY
97.3/ 100
METRIC RATING
97th/ 347
METRIC RANK
87.0%
GED/EQUIVALENCY
94.8/ 100
METRIC RATING
112th/ 347
METRIC RANK
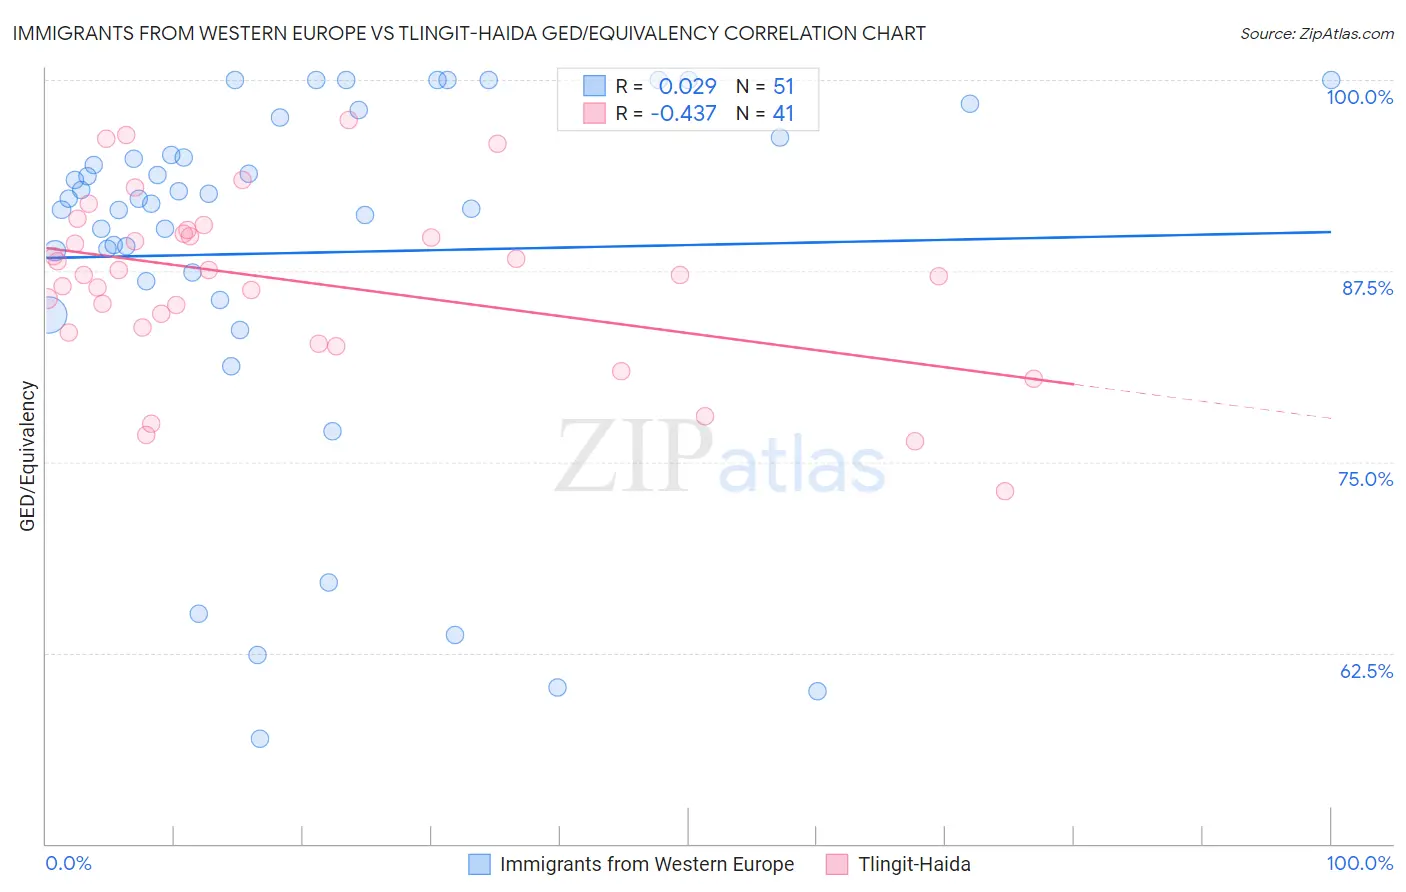
Immigrants from Western Europe vs Tlingit-Haida GED/Equivalency Correlation Chart
The statistical analysis conducted on geographies consisting of 494,080,521 people shows no correlation between the proportion of Immigrants from Western Europe and percentage of population with at least ged/equivalency education in the United States with a correlation coefficient (R) of 0.029 and weighted average of 87.3%. Similarly, the statistical analysis conducted on geographies consisting of 60,871,919 people shows a moderate negative correlation between the proportion of Tlingit-Haida and percentage of population with at least ged/equivalency education in the United States with a correlation coefficient (R) of -0.437 and weighted average of 87.0%, a difference of 0.34%.
GED/Equivalency Correlation Summary
| Measurement | Immigrants from Western Europe | Tlingit-Haida |
| Minimum | 56.9% | 73.1% |
| Maximum | 100.0% | 97.4% |
| Range | 43.1% | 24.3% |
| Mean | 88.7% | 86.9% |
| Median | 92.2% | 87.2% |
| Interquartile 25% (IQ1) | 86.8% | 83.6% |
| Interquartile 75% (IQ3) | 96.2% | 90.1% |
| Interquartile Range (IQR) | 9.4% | 6.4% |
| Standard Deviation (Sample) | 11.9% | 5.6% |
| Standard Deviation (Population) | 11.8% | 5.6% |
Demographics Similar to Immigrants from Western Europe and Tlingit-Haida by GED/Equivalency
In terms of ged/equivalency, the demographic groups most similar to Immigrants from Western Europe are Czechoslovakian (87.4%, a difference of 0.070%), Immigrants from Croatia (87.3%, a difference of 0.070%), Immigrants from Belarus (87.3%, a difference of 0.070%), Immigrants from Greece (87.4%, a difference of 0.090%), and Palestinian (87.3%, a difference of 0.090%). Similarly, the demographic groups most similar to Tlingit-Haida are Assyrian/Chaldean/Syriac (87.0%, a difference of 0.0%), Immigrants from Kazakhstan (87.0%, a difference of 0.010%), Egyptian (87.1%, a difference of 0.050%), French (87.1%, a difference of 0.050%), and Immigrants from Eastern Europe (87.1%, a difference of 0.080%).
| Demographics | Rating | Rank | GED/Equivalency |
| Immigrants | Russia | 97.8 /100 | #94 | Exceptional 87.4% |
| Immigrants | Greece | 97.7 /100 | #95 | Exceptional 87.4% |
| Czechoslovakians | 97.6 /100 | #96 | Exceptional 87.4% |
| Immigrants | Western Europe | 97.3 /100 | #97 | Exceptional 87.3% |
| Immigrants | Croatia | 96.9 /100 | #98 | Exceptional 87.3% |
| Immigrants | Belarus | 96.9 /100 | #99 | Exceptional 87.3% |
| Palestinians | 96.8 /100 | #100 | Exceptional 87.3% |
| Syrians | 96.6 /100 | #101 | Exceptional 87.2% |
| Lebanese | 96.2 /100 | #102 | Exceptional 87.2% |
| Jordanians | 96.1 /100 | #103 | Exceptional 87.2% |
| Immigrants | Hungary | 96.0 /100 | #104 | Exceptional 87.2% |
| Indians (Asian) | 95.9 /100 | #105 | Exceptional 87.1% |
| Immigrants | Zimbabwe | 95.8 /100 | #106 | Exceptional 87.1% |
| Icelanders | 95.7 /100 | #107 | Exceptional 87.1% |
| Canadians | 95.6 /100 | #108 | Exceptional 87.1% |
| Immigrants | Eastern Europe | 95.5 /100 | #109 | Exceptional 87.1% |
| Egyptians | 95.3 /100 | #110 | Exceptional 87.1% |
| French | 95.2 /100 | #111 | Exceptional 87.1% |
| Tlingit-Haida | 94.8 /100 | #112 | Exceptional 87.0% |
| Assyrians/Chaldeans/Syriacs | 94.8 /100 | #113 | Exceptional 87.0% |
| Immigrants | Kazakhstan | 94.7 /100 | #114 | Exceptional 87.0% |