Immigrants from Western Europe vs Immigrants from Nigeria GED/Equivalency
COMPARE
Immigrants from Western Europe
Immigrants from Nigeria
GED/Equivalency
GED/Equivalency Comparison
Immigrants from Western Europe
Immigrants from Nigeria
87.3%
GED/EQUIVALENCY
97.3/ 100
METRIC RATING
97th/ 347
METRIC RANK
84.3%
GED/EQUIVALENCY
3.6/ 100
METRIC RATING
234th/ 347
METRIC RANK
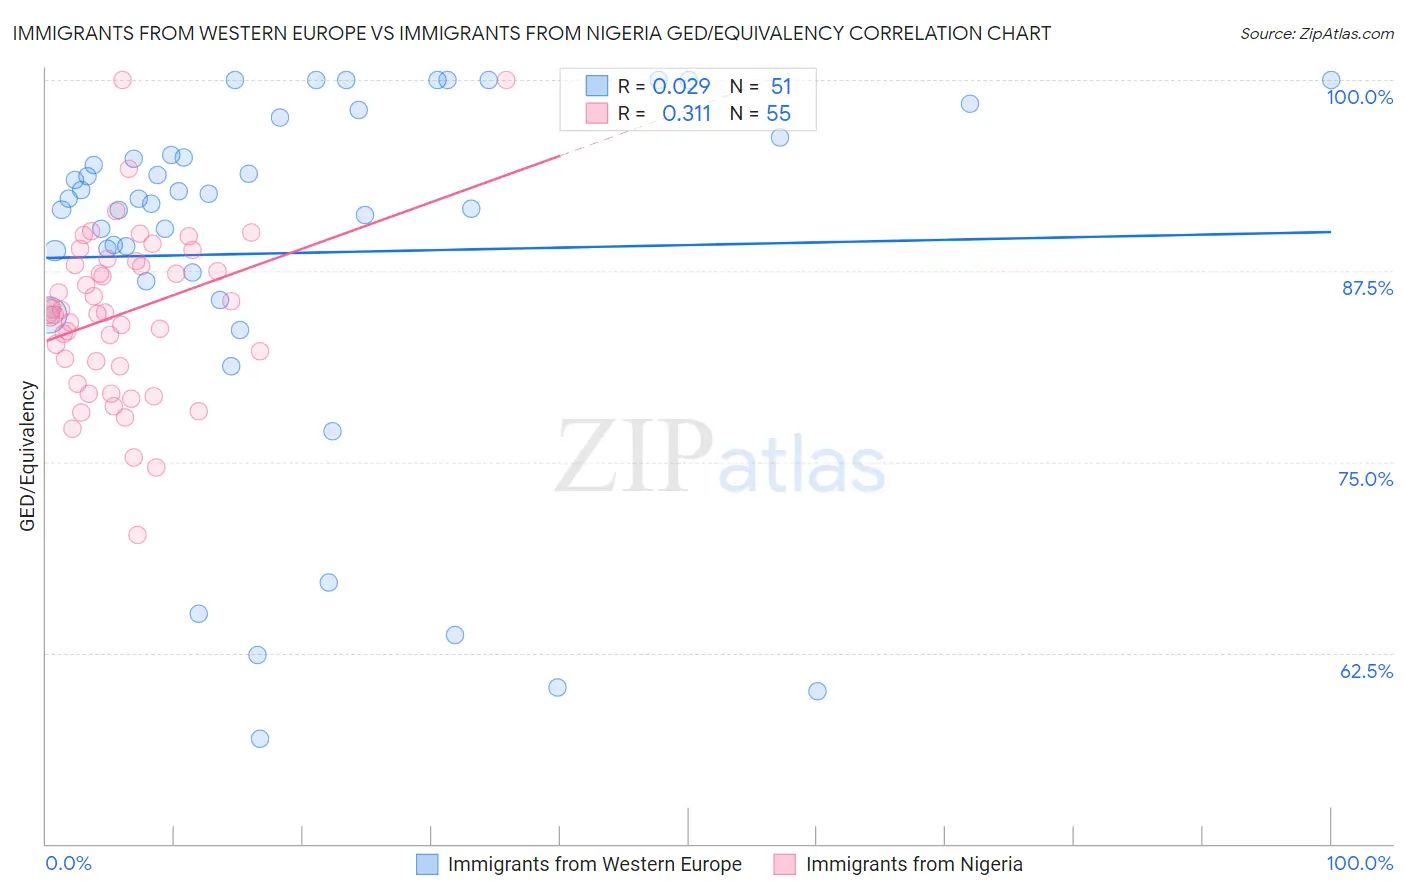
Immigrants from Western Europe vs Immigrants from Nigeria GED/Equivalency Correlation Chart
The statistical analysis conducted on geographies consisting of 494,080,521 people shows no correlation between the proportion of Immigrants from Western Europe and percentage of population with at least ged/equivalency education in the United States with a correlation coefficient (R) of 0.029 and weighted average of 87.3%. Similarly, the statistical analysis conducted on geographies consisting of 283,441,873 people shows a mild positive correlation between the proportion of Immigrants from Nigeria and percentage of population with at least ged/equivalency education in the United States with a correlation coefficient (R) of 0.311 and weighted average of 84.3%, a difference of 3.6%.
GED/Equivalency Correlation Summary
| Measurement | Immigrants from Western Europe | Immigrants from Nigeria |
| Minimum | 56.9% | 70.2% |
| Maximum | 100.0% | 100.0% |
| Range | 43.1% | 29.8% |
| Mean | 88.7% | 84.7% |
| Median | 92.2% | 84.8% |
| Interquartile 25% (IQ1) | 86.8% | 81.3% |
| Interquartile 75% (IQ3) | 96.2% | 88.1% |
| Interquartile Range (IQR) | 9.4% | 6.8% |
| Standard Deviation (Sample) | 11.9% | 5.6% |
| Standard Deviation (Population) | 11.8% | 5.5% |
Similar Demographics by GED/Equivalency
Demographics Similar to Immigrants from Western Europe by GED/Equivalency
In terms of ged/equivalency, the demographic groups most similar to Immigrants from Western Europe are Czechoslovakian (87.4%, a difference of 0.070%), Immigrants from Croatia (87.3%, a difference of 0.070%), Immigrants from Belarus (87.3%, a difference of 0.070%), Immigrants from Greece (87.4%, a difference of 0.090%), and Palestinian (87.3%, a difference of 0.090%).
| Demographics | Rating | Rank | GED/Equivalency |
| Welsh | 97.9 /100 | #90 | Exceptional 87.4% |
| Immigrants | Eastern Asia | 97.9 /100 | #91 | Exceptional 87.4% |
| Israelis | 97.8 /100 | #92 | Exceptional 87.4% |
| Immigrants | North Macedonia | 97.8 /100 | #93 | Exceptional 87.4% |
| Immigrants | Russia | 97.8 /100 | #94 | Exceptional 87.4% |
| Immigrants | Greece | 97.7 /100 | #95 | Exceptional 87.4% |
| Czechoslovakians | 97.6 /100 | #96 | Exceptional 87.4% |
| Immigrants | Western Europe | 97.3 /100 | #97 | Exceptional 87.3% |
| Immigrants | Croatia | 96.9 /100 | #98 | Exceptional 87.3% |
| Immigrants | Belarus | 96.9 /100 | #99 | Exceptional 87.3% |
| Palestinians | 96.8 /100 | #100 | Exceptional 87.3% |
| Syrians | 96.6 /100 | #101 | Exceptional 87.2% |
| Lebanese | 96.2 /100 | #102 | Exceptional 87.2% |
| Jordanians | 96.1 /100 | #103 | Exceptional 87.2% |
| Immigrants | Hungary | 96.0 /100 | #104 | Exceptional 87.2% |
Demographics Similar to Immigrants from Nigeria by GED/Equivalency
In terms of ged/equivalency, the demographic groups most similar to Immigrants from Nigeria are Ghanaian (84.3%, a difference of 0.020%), Immigrants from Eritrea (84.3%, a difference of 0.020%), Immigrants from Panama (84.4%, a difference of 0.070%), Immigrants from South America (84.4%, a difference of 0.080%), and Immigrants from Middle Africa (84.4%, a difference of 0.10%).
| Demographics | Rating | Rank | GED/Equivalency |
| Immigrants | Costa Rica | 5.4 /100 | #227 | Tragic 84.5% |
| Immigrants | Liberia | 4.9 /100 | #228 | Tragic 84.4% |
| Immigrants | Uruguay | 4.6 /100 | #229 | Tragic 84.4% |
| Immigrants | Colombia | 4.5 /100 | #230 | Tragic 84.4% |
| Immigrants | Middle Africa | 4.3 /100 | #231 | Tragic 84.4% |
| Immigrants | South America | 4.2 /100 | #232 | Tragic 84.4% |
| Immigrants | Panama | 4.1 /100 | #233 | Tragic 84.4% |
| Immigrants | Nigeria | 3.6 /100 | #234 | Tragic 84.3% |
| Ghanaians | 3.5 /100 | #235 | Tragic 84.3% |
| Immigrants | Eritrea | 3.5 /100 | #236 | Tragic 84.3% |
| Sub-Saharan Africans | 3.0 /100 | #237 | Tragic 84.2% |
| Immigrants | Peru | 2.7 /100 | #238 | Tragic 84.2% |
| Immigrants | Bahamas | 2.6 /100 | #239 | Tragic 84.2% |
| Immigrants | South Eastern Asia | 2.5 /100 | #240 | Tragic 84.1% |
| Senegalese | 1.9 /100 | #241 | Tragic 84.0% |