Ukrainian vs Immigrants from Fiji Disability Age 5 to 17
COMPARE
Ukrainian
Immigrants from Fiji
Disability Age 5 to 17
Disability Age 5 to 17 Comparison
Ukrainians
Immigrants from Fiji
5.6%
DISABILITY AGE 5 TO 17
51.5/ 100
METRIC RATING
172nd/ 347
METRIC RANK
5.1%
DISABILITY AGE 5 TO 17
99.9/ 100
METRIC RATING
52nd/ 347
METRIC RANK
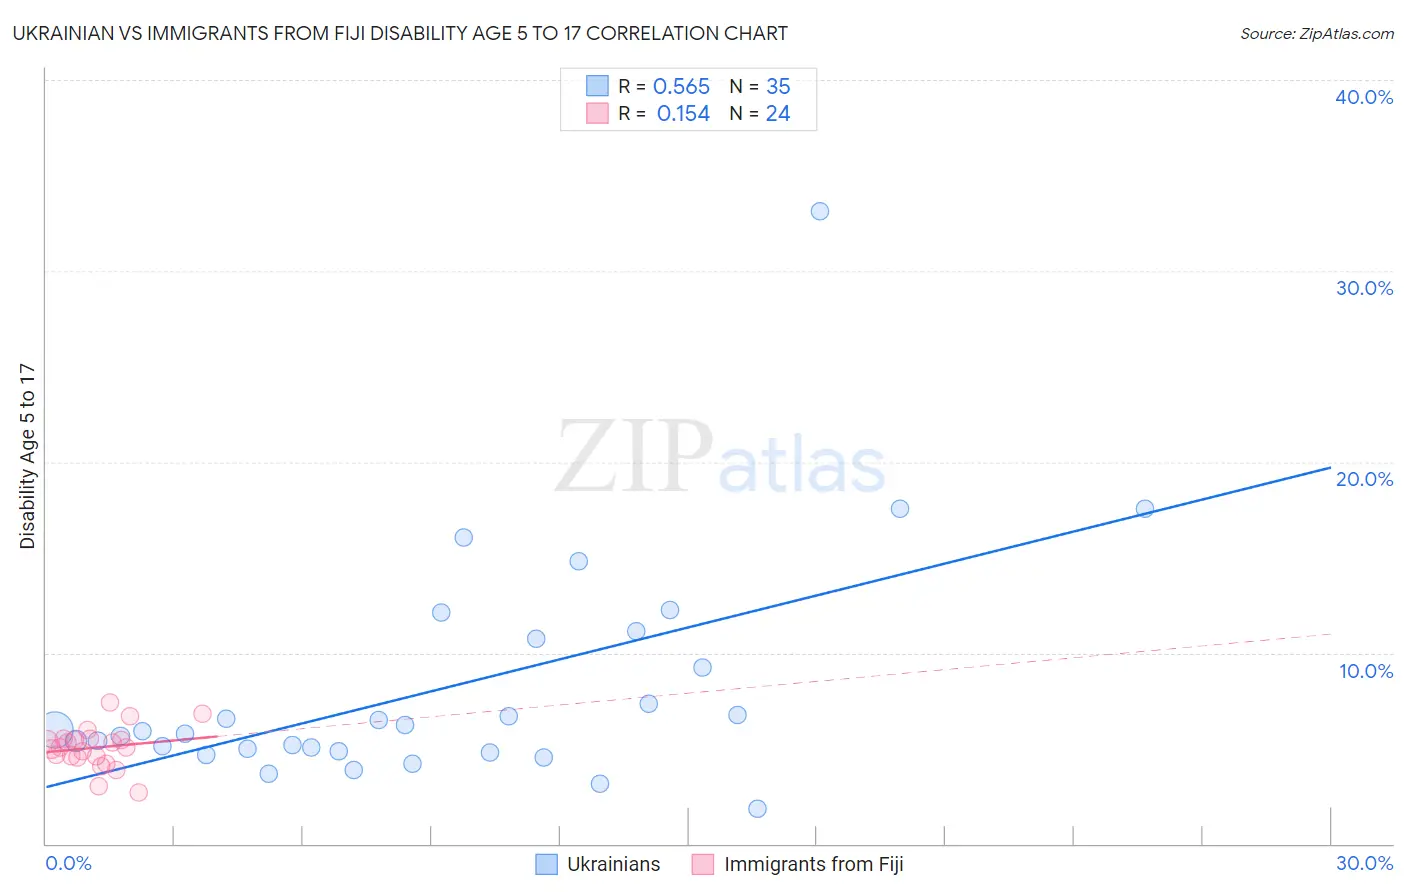
Ukrainian vs Immigrants from Fiji Disability Age 5 to 17 Correlation Chart
The statistical analysis conducted on geographies consisting of 442,807,363 people shows a substantial positive correlation between the proportion of Ukrainians and percentage of population with a disability between the ages 5 and 17 in the United States with a correlation coefficient (R) of 0.565 and weighted average of 5.6%. Similarly, the statistical analysis conducted on geographies consisting of 93,508,767 people shows a poor positive correlation between the proportion of Immigrants from Fiji and percentage of population with a disability between the ages 5 and 17 in the United States with a correlation coefficient (R) of 0.154 and weighted average of 5.1%, a difference of 9.6%.
Disability Age 5 to 17 Correlation Summary
| Measurement | Ukrainian | Immigrants from Fiji |
| Minimum | 1.8% | 2.7% |
| Maximum | 33.1% | 7.4% |
| Range | 31.3% | 4.7% |
| Mean | 8.1% | 5.0% |
| Median | 5.9% | 5.0% |
| Interquartile 25% (IQ1) | 4.8% | 4.6% |
| Interquartile 75% (IQ3) | 10.7% | 5.5% |
| Interquartile Range (IQR) | 5.9% | 0.92% |
| Standard Deviation (Sample) | 6.0% | 1.1% |
| Standard Deviation (Population) | 5.9% | 1.1% |
Similar Demographics by Disability Age 5 to 17
Demographics Similar to Ukrainians by Disability Age 5 to 17
In terms of disability age 5 to 17, the demographic groups most similar to Ukrainians are Uruguayan (5.6%, a difference of 0.030%), Costa Rican (5.6%, a difference of 0.080%), Shoshone (5.6%, a difference of 0.10%), Immigrants from Central America (5.6%, a difference of 0.11%), and Serbian (5.6%, a difference of 0.12%).
| Demographics | Rating | Rank | Disability Age 5 to 17 |
| Lebanese | 61.4 /100 | #165 | Good 5.6% |
| Greeks | 60.6 /100 | #166 | Good 5.6% |
| Immigrants | Burma/Myanmar | 59.3 /100 | #167 | Average 5.6% |
| Iraqis | 56.0 /100 | #168 | Average 5.6% |
| Immigrants | Norway | 55.7 /100 | #169 | Average 5.6% |
| Serbians | 54.0 /100 | #170 | Average 5.6% |
| Immigrants | Iraq | 53.9 /100 | #171 | Average 5.6% |
| Ukrainians | 51.5 /100 | #172 | Average 5.6% |
| Uruguayans | 51.0 /100 | #173 | Average 5.6% |
| Costa Ricans | 50.0 /100 | #174 | Average 5.6% |
| Shoshone | 49.4 /100 | #175 | Average 5.6% |
| Immigrants | Central America | 49.4 /100 | #176 | Average 5.6% |
| Immigrants | Western Europe | 47.8 /100 | #177 | Average 5.6% |
| Immigrants | Trinidad and Tobago | 47.6 /100 | #178 | Average 5.6% |
| Immigrants | Barbados | 40.5 /100 | #179 | Average 5.6% |
Demographics Similar to Immigrants from Fiji by Disability Age 5 to 17
In terms of disability age 5 to 17, the demographic groups most similar to Immigrants from Fiji are Immigrants from Lithuania (5.1%, a difference of 0.050%), Paraguayan (5.1%, a difference of 0.080%), Turkish (5.1%, a difference of 0.090%), Laotian (5.1%, a difference of 0.13%), and Immigrants from Turkey (5.1%, a difference of 0.14%).
| Demographics | Rating | Rank | Disability Age 5 to 17 |
| Tongans | 100.0 /100 | #45 | Exceptional 5.0% |
| Assyrians/Chaldeans/Syriacs | 100.0 /100 | #46 | Exceptional 5.0% |
| Vietnamese | 100.0 /100 | #47 | Exceptional 5.1% |
| Koreans | 100.0 /100 | #48 | Exceptional 5.1% |
| Immigrants | Western Asia | 100.0 /100 | #49 | Exceptional 5.1% |
| Argentineans | 99.9 /100 | #50 | Exceptional 5.1% |
| Turks | 99.9 /100 | #51 | Exceptional 5.1% |
| Immigrants | Fiji | 99.9 /100 | #52 | Exceptional 5.1% |
| Immigrants | Lithuania | 99.9 /100 | #53 | Exceptional 5.1% |
| Paraguayans | 99.9 /100 | #54 | Exceptional 5.1% |
| Laotians | 99.9 /100 | #55 | Exceptional 5.1% |
| Immigrants | Turkey | 99.9 /100 | #56 | Exceptional 5.1% |
| Immigrants | Poland | 99.9 /100 | #57 | Exceptional 5.1% |
| Immigrants | Ukraine | 99.9 /100 | #58 | Exceptional 5.1% |
| Immigrants | North Macedonia | 99.9 /100 | #59 | Exceptional 5.1% |