Pennsylvania German vs Brazilian Self-Care Disability

COMPARE

Pennsylvania German
Race
Ancestry
AfghanAfricanAlaska NativeAlaskan AthabascanAlbanianAleutAlsatianAmericanApacheArabArapahoArgentineanArmenianAssyrian/Chaldean/SyriacAustralianAustrianBahamianBangladeshiBarbadianBasqueBelgianBelizeanBermudanBhutaneseBlackfeetBolivianBritishBritish West IndianBulgarianBurmeseCajunCambodianCanadianCape VerdeanCarpatho RusynCelticCentral AmericanCentral American IndianCherokeeCheyenneChickasawChileanChineseChippewaChoctawColombianColvilleComancheCosta RicanCreeCreekCroatianCrowCubanCypriotCzechCzechoslovakianDanishDelawareDominicanDutchDutch West IndianEastern EuropeanEcuadorianEgyptianEnglishEstonianEthiopianEuropeanFijianFilipinoFinnishFrenchFrench American IndianFrench CanadianGermanGerman RussianGhanaianGreekGuamanian/ChamorroGuatemalanGuyaneseHaitianHmongHonduranHopiHoumaHungarianIcelanderIndian (Asian)IndonesianInupiatIranianIraqiIrishIroquoisIsraeliItalianJamaicanJapaneseJordanianKenyanKiowaKoreanLaotianLatvianLebaneseLiberianLithuanianLumbeeLuxembourgerMacedonianMalaysianMalteseMarshalleseMenomineeMexicanMexican American IndianMongolianMoroccanNative HawaiianNavajoNepaleseNew ZealanderNicaraguanNigerianNorthern EuropeanNorwegianOkinawanOsageOttawaPaiutePakistaniPalestinianPanamanianParaguayanPennsylvania GermanPeruvianPimaPolishPortuguesePotawatomiPuebloPuerto RicanPuget Sound SalishRomanianRussianSalvadoranSamoanScandinavianScotch-IrishScottishSeminoleSenegaleseSerbianShoshoneSierra LeoneanSiouxSlavicSlovakSloveneSomaliSouth AfricanSouth AmericanSouth American IndianSoviet UnionSpaniardSpanishSpanish AmericanSpanish American IndianSri LankanSubsaharan AfricanSudaneseSwedishSwissSyrianTaiwaneseThaiTlingit-HaidaTohono O'OdhamTonganTrinidadian and TobagonianTsimshianTurkishU.S. Virgin IslanderUgandanUkrainianUruguayanUteVenezuelanVietnameseWelshWest IndianYakamaYaquiYugoslavianYumanYup'ikZimbabwean
Immigration
NonimmigrantsImmigrantsAfghanistanAfricaAlbaniaArgentinaArmeniaAsiaAustraliaAustriaBahamasBangladeshBarbadosBelarusBelgiumBelizeBoliviaBosnia and HerzegovinaBrazilBulgariaBurma/MyanmarCabo VerdeCambodiaCameroonCanadaCaribbeanCentral AmericaChileChinaColombiaCongoCosta RicaCroatiaCubaCzechoslovakiaDenmarkDominicaDominican RepublicEastern AfricaEastern AsiaEastern EuropeEcuadorEgyptEl SalvadorEnglandEritreaEthiopiaEuropeFijiFranceGermanyGhanaGreeceGrenadaGuatemalaGuyanaHaitiHondurasHong KongHungaryIndiaIndonesiaIranIraqIrelandIsraelItalyJamaicaJapanJordanKazakhstanKenyaKoreaKuwaitLaosLatin AmericaLatviaLebanonLiberiaLithuaniaMalaysiaMexicoMicronesiaMiddle AfricaMoldovaMoroccoNepalNetherlandsNicaraguaNigeriaNorth AmericaNorth MacedoniaNorthern AfricaNorthern EuropeNorwayOceaniaPakistanPanamaPeruPhilippinesPolandPortugalRomaniaRussiaSaudi ArabiaScotlandSenegalSerbiaSierra LeoneSingaporeSomaliaSouth AfricaSouth AmericaSouth Central AsiaSouth Eastern AsiaSouthern EuropeSpainSri LankaSt. Vincent and the GrenadinesSudanSwedenSwitzerlandSyriaTaiwanThailandTrinidad and TobagoTurkeyUgandaUkraineUruguayUzbekistanVenezuelaVietnamWest IndiesWestern AfricaWestern AsiaWestern EuropeYemenZaireZimbabweAzores
Brazilian
Race
Ancestry
AfghanAfricanAlaska NativeAlaskan AthabascanAlbanianAleutAlsatianAmericanApacheArabArapahoArgentineanArmenianAssyrian/Chaldean/SyriacAustralianAustrianBahamianBangladeshiBarbadianBasqueBelgianBelizeanBermudanBhutaneseBlackfeetBolivianBrazilianBritishBritish West IndianBulgarianBurmeseCajunCambodianCanadianCape VerdeanCarpatho RusynCelticCentral AmericanCentral American IndianCherokeeCheyenneChickasawChileanChineseChippewaChoctawColombianColvilleComancheCosta RicanCreeCreekCroatianCrowCubanCypriotCzechCzechoslovakianDanishDelawareDominicanDutchDutch West IndianEastern EuropeanEcuadorianEgyptianEnglishEstonianEthiopianEuropeanFijianFilipinoFinnishFrenchFrench American IndianFrench CanadianGermanGerman RussianGhanaianGreekGuamanian/ChamorroGuatemalanGuyaneseHaitianHmongHonduranHopiHoumaHungarianIcelanderIndian (Asian)IndonesianInupiatIranianIraqiIrishIroquoisIsraeliItalianJamaicanJapaneseJordanianKenyanKiowaKoreanLaotianLatvianLebaneseLiberianLithuanianLumbeeLuxembourgerMacedonianMalaysianMalteseMarshalleseMenomineeMexicanMexican American IndianMongolianMoroccanNative HawaiianNavajoNepaleseNew ZealanderNicaraguanNigerianNorthern EuropeanNorwegianOkinawanOsageOttawaPaiutePakistaniPalestinianPanamanianParaguayanPeruvianPimaPolishPortuguesePotawatomiPuebloPuerto RicanPuget Sound SalishRomanianRussianSalvadoranSamoanScandinavianScotch-IrishScottishSeminoleSenegaleseSerbianShoshoneSierra LeoneanSiouxSlavicSlovakSloveneSomaliSouth AfricanSouth AmericanSouth American IndianSoviet UnionSpaniardSpanishSpanish AmericanSpanish American IndianSri LankanSubsaharan AfricanSudaneseSwedishSwissSyrianTaiwaneseThaiTlingit-HaidaTohono O'OdhamTonganTrinidadian and TobagonianTsimshianTurkishU.S. Virgin IslanderUgandanUkrainianUruguayanUteVenezuelanVietnameseWelshWest IndianYakamaYaquiYugoslavianYumanYup'ikZimbabwean
Immigration
NonimmigrantsImmigrantsAfghanistanAfricaAlbaniaArgentinaArmeniaAsiaAustraliaAustriaBahamasBangladeshBarbadosBelarusBelgiumBelizeBoliviaBosnia and HerzegovinaBrazilBulgariaBurma/MyanmarCabo VerdeCambodiaCameroonCanadaCaribbeanCentral AmericaChileChinaColombiaCongoCosta RicaCroatiaCubaCzechoslovakiaDenmarkDominicaDominican RepublicEastern AfricaEastern AsiaEastern EuropeEcuadorEgyptEl SalvadorEnglandEritreaEthiopiaEuropeFijiFranceGermanyGhanaGreeceGrenadaGuatemalaGuyanaHaitiHondurasHong KongHungaryIndiaIndonesiaIranIraqIrelandIsraelItalyJamaicaJapanJordanKazakhstanKenyaKoreaKuwaitLaosLatin AmericaLatviaLebanonLiberiaLithuaniaMalaysiaMexicoMicronesiaMiddle AfricaMoldovaMoroccoNepalNetherlandsNicaraguaNigeriaNorth AmericaNorth MacedoniaNorthern AfricaNorthern EuropeNorwayOceaniaPakistanPanamaPeruPhilippinesPolandPortugalRomaniaRussiaSaudi ArabiaScotlandSenegalSerbiaSierra LeoneSingaporeSomaliaSouth AfricaSouth AmericaSouth Central AsiaSouth Eastern AsiaSouthern EuropeSpainSri LankaSt. Vincent and the GrenadinesSudanSwedenSwitzerlandSyriaTaiwanThailandTrinidad and TobagoTurkeyUgandaUkraineUruguayUzbekistanVenezuelaVietnamWest IndiesWestern AfricaWestern AsiaWestern EuropeYemenZaireZimbabweAzores
Self-Care Disability
Income
Poverty
Unemployment
Labor Participation
Family Structure
Vehicle Availability
Education Level
Disability

Self-Care Disability Comparison

Pennsylvania Germans

Brazilians

Average
Exceptional
2.5%
SELF-CARE DISABILITY
53.5/ 100
METRIC RATING
171st/ 347
METRIC RANK
2.3%
SELF-CARE DISABILITY
99.3/ 100
METRIC RATING
65th/ 347
METRIC RANK

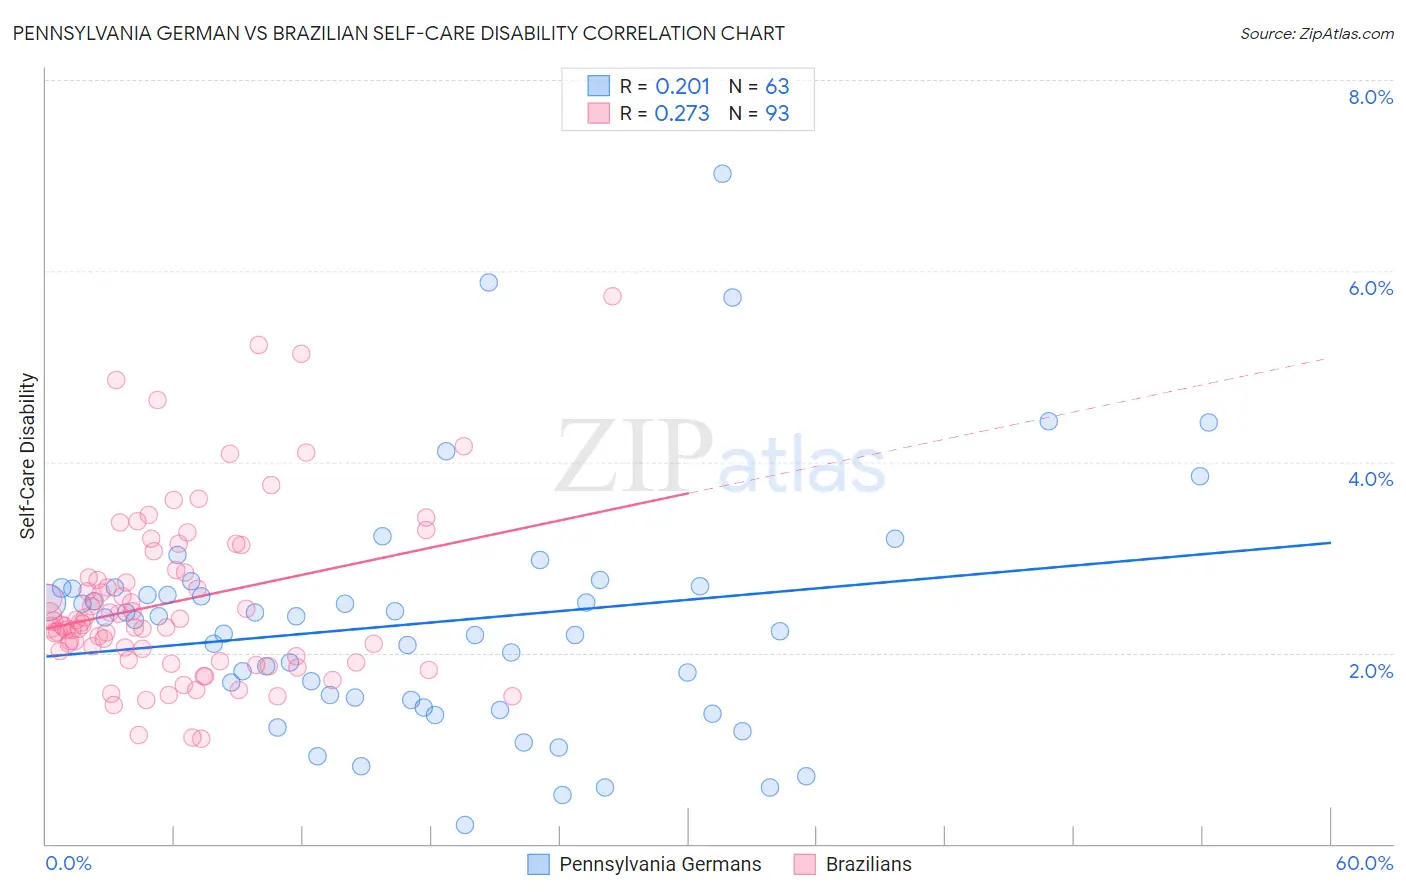
Pennsylvania German vs Brazilian Self-Care Disability Correlation Chart

The statistical analysis conducted on geographies consisting of 233,939,530 people shows a weak positive correlation between the proportion of Pennsylvania Germans and percentage of population with self-care disability in the United States with a correlation coefficient (R) of 0.201 and weighted average of 2.5%. Similarly, the statistical analysis conducted on geographies consisting of 323,606,660 people shows a weak positive correlation between the proportion of Brazilians and percentage of population with self-care disability in the United States with a correlation coefficient (R) of 0.273 and weighted average of 2.3%, a difference of 6.1%.
Pennsylvania German vs Brazilian Self-Care Disability

Self-Care Disability Correlation Summary

MeasurementPennsylvania GermanBrazilian
Minimum0.19%1.1%
Maximum7.0%5.7%
Range6.8%4.6%
Mean2.3%2.5%
Median2.3%2.3%
Interquartile 25% (IQ1)1.5%1.9%
Interquartile 75% (IQ3)2.7%2.9%
Interquartile Range (IQR)1.2%0.91%
Standard Deviation (Sample)1.3%0.90%
Standard Deviation (Population)1.2%0.90%

Similar Demographics by Self-Care Disability

Demographics Similar to Pennsylvania Germans by Self-Care Disability

In terms of self-care disability, the demographic groups most similar to Pennsylvania Germans are Czechoslovakian (2.5%, a difference of 0.0%), Scottish (2.5%, a difference of 0.030%), Immigrants from Burma/Myanmar (2.5%, a difference of 0.030%), Immigrants from Somalia (2.5%, a difference of 0.11%), and Ute (2.5%, a difference of 0.17%).
DemographicsRating | RankSelf-Care Disability
Immigrants | Vietnam
59.3
/100
|
#164
Average
2.5%
Syrians
59.0
/100
|
#165
Average
2.5%
Canadians
58.8
/100
|
#166
Average
2.5%
Immigrants | Greece
57.3
/100
|
#167
Average
2.5%
Ute
57.1
/100
|
#168
Average
2.5%
Immigrants | Somalia
55.9
/100
|
#169
Average
2.5%
Scottish
54.3
/100
|
#170
Average
2.5%
Pennsylvania Germans
53.5
/100
|
#171
Average
2.5%
Czechoslovakians
53.5
/100
|
#172
Average
2.5%
Immigrants | Burma/Myanmar
52.8
/100
|
#173
Average
2.5%
Welsh
50.0
/100
|
#174
Average
2.5%
Immigrants | Bosnia and Herzegovina
49.6
/100
|
#175
Average
2.5%
Immigrants | Afghanistan
47.6
/100
|
#176
Average
2.5%
Immigrants | Kazakhstan
46.7
/100
|
#177
Average
2.5%
English
46.2
/100
|
#178
Average
2.5%

Demographics Similar to Brazilians by Self-Care Disability

In terms of self-care disability, the demographic groups most similar to Brazilians are Immigrants from Argentina (2.3%, a difference of 0.030%), Swedish (2.3%, a difference of 0.060%), South African (2.3%, a difference of 0.060%), Mongolian (2.3%, a difference of 0.070%), and Immigrants from Zaire (2.3%, a difference of 0.15%).
DemographicsRating | RankSelf-Care Disability
Immigrants | Cameroon
99.6
/100
|
#58
Exceptional
2.3%
New Zealanders
99.5
/100
|
#59
Exceptional
2.3%
Immigrants | Japan
99.5
/100
|
#60
Exceptional
2.3%
Palestinians
99.4
/100
|
#61
Exceptional
2.3%
Egyptians
99.4
/100
|
#62
Exceptional
2.3%
Mongolians
99.3
/100
|
#63
Exceptional
2.3%
Swedes
99.3
/100
|
#64
Exceptional
2.3%
Brazilians
99.3
/100
|
#65
Exceptional
2.3%
Immigrants | Argentina
99.3
/100
|
#66
Exceptional
2.3%
South Africans
99.3
/100
|
#67
Exceptional
2.3%
Immigrants | Zaire
99.2
/100
|
#68
Exceptional
2.3%
Immigrants | Norway
99.2
/100
|
#69
Exceptional
2.3%
Immigrants | Northern Europe
99.2
/100
|
#70
Exceptional
2.3%
Asians
99.2
/100
|
#71
Exceptional
2.3%
Eastern Europeans
99.2
/100
|
#72
Exceptional
2.3%