Nigerian vs Immigrants from Eastern Africa Disability
COMPARE
Nigerian
Immigrants from Eastern Africa
Disability
Disability Comparison
Nigerians
Immigrants from Eastern Africa
11.5%
DISABILITY
81.3/ 100
METRIC RATING
145th/ 347
METRIC RANK
11.3%
DISABILITY
96.7/ 100
METRIC RATING
102nd/ 347
METRIC RANK
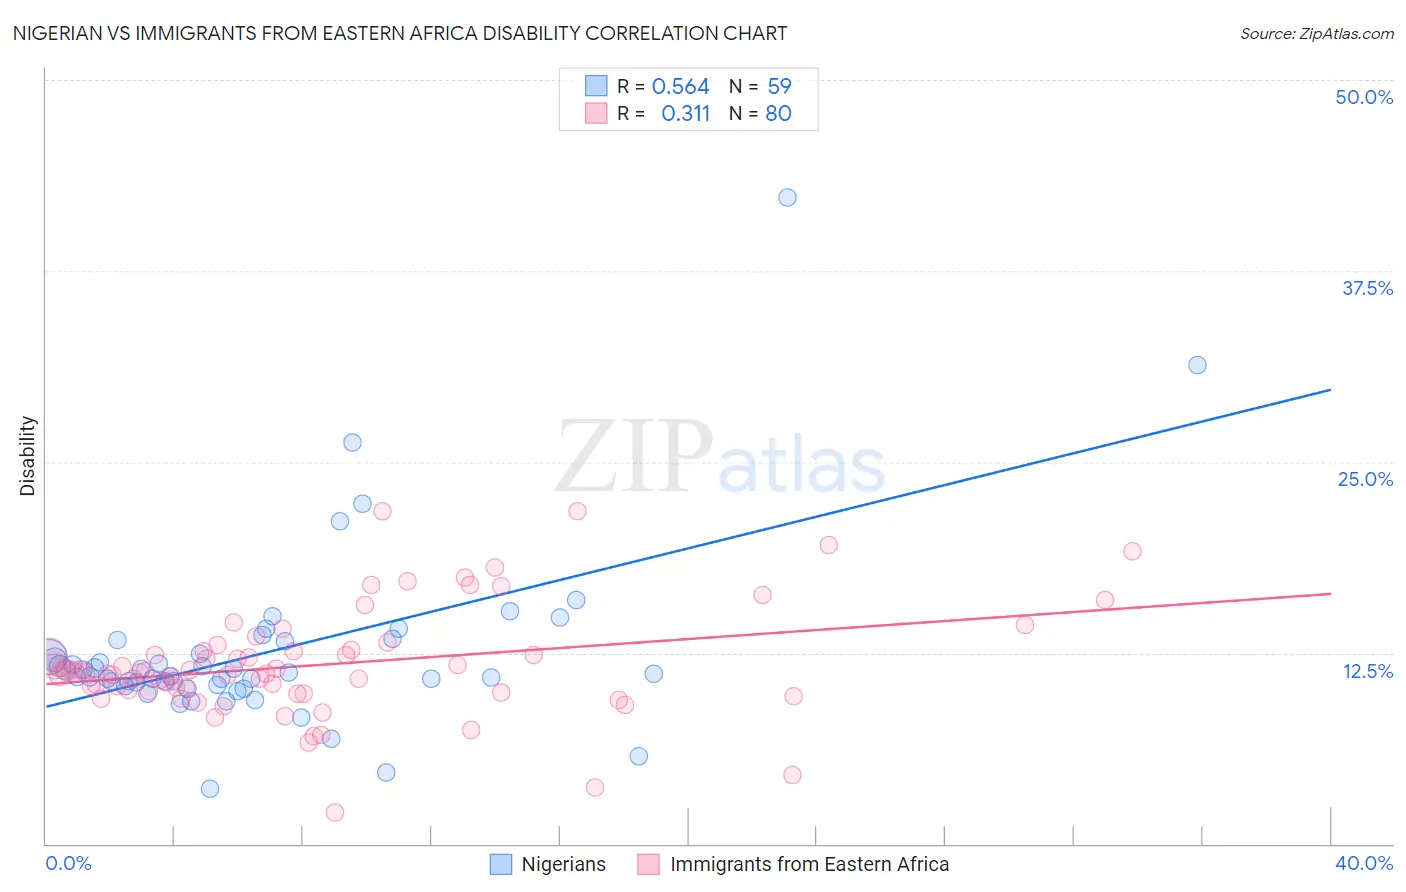
Nigerian vs Immigrants from Eastern Africa Disability Correlation Chart
The statistical analysis conducted on geographies consisting of 332,745,371 people shows a substantial positive correlation between the proportion of Nigerians and percentage of population with a disability in the United States with a correlation coefficient (R) of 0.564 and weighted average of 11.5%. Similarly, the statistical analysis conducted on geographies consisting of 355,125,072 people shows a mild positive correlation between the proportion of Immigrants from Eastern Africa and percentage of population with a disability in the United States with a correlation coefficient (R) of 0.311 and weighted average of 11.3%, a difference of 2.2%.
Disability Correlation Summary
| Measurement | Nigerian | Immigrants from Eastern Africa |
| Minimum | 3.6% | 2.1% |
| Maximum | 42.3% | 21.8% |
| Range | 38.7% | 19.7% |
| Mean | 12.5% | 11.7% |
| Median | 11.1% | 11.2% |
| Interquartile 25% (IQ1) | 10.4% | 10.0% |
| Interquartile 75% (IQ3) | 13.3% | 12.7% |
| Interquartile Range (IQR) | 2.9% | 2.7% |
| Standard Deviation (Sample) | 5.9% | 3.5% |
| Standard Deviation (Population) | 5.8% | 3.5% |
Similar Demographics by Disability
Demographics Similar to Nigerians by Disability
In terms of disability, the demographic groups most similar to Nigerians are Australian (11.5%, a difference of 0.090%), Moroccan (11.5%, a difference of 0.15%), Immigrants from Hungary (11.5%, a difference of 0.16%), Immigrants from Ukraine (11.5%, a difference of 0.26%), and Sudanese (11.5%, a difference of 0.29%).
| Demographics | Rating | Rank | Disability |
| New Zealanders | 87.0 /100 | #138 | Excellent 11.5% |
| Ghanaians | 87.0 /100 | #139 | Excellent 11.5% |
| Russians | 86.8 /100 | #140 | Excellent 11.5% |
| Immigrants | Grenada | 86.1 /100 | #141 | Excellent 11.5% |
| Immigrants | Sudan | 85.3 /100 | #142 | Excellent 11.5% |
| Moroccans | 83.3 /100 | #143 | Excellent 11.5% |
| Australians | 82.5 /100 | #144 | Excellent 11.5% |
| Nigerians | 81.3 /100 | #145 | Excellent 11.5% |
| Immigrants | Hungary | 79.0 /100 | #146 | Good 11.5% |
| Immigrants | Ukraine | 77.6 /100 | #147 | Good 11.5% |
| Sudanese | 77.1 /100 | #148 | Good 11.5% |
| Immigrants | Norway | 73.2 /100 | #149 | Good 11.6% |
| Romanians | 72.7 /100 | #150 | Good 11.6% |
| Immigrants | Kenya | 72.1 /100 | #151 | Good 11.6% |
| Immigrants | Moldova | 72.0 /100 | #152 | Good 11.6% |
Demographics Similar to Immigrants from Eastern Africa by Disability
In terms of disability, the demographic groups most similar to Immigrants from Eastern Africa are Immigrants from Nicaragua (11.3%, a difference of 0.060%), Immigrants from Uruguay (11.3%, a difference of 0.070%), Immigrants (11.3%, a difference of 0.080%), Immigrants from Kazakhstan (11.3%, a difference of 0.090%), and Immigrants from Greece (11.3%, a difference of 0.11%).
| Demographics | Rating | Rank | Disability |
| Eastern Europeans | 97.8 /100 | #95 | Exceptional 11.2% |
| Immigrants | Zimbabwe | 97.7 /100 | #96 | Exceptional 11.2% |
| Bhutanese | 97.4 /100 | #97 | Exceptional 11.2% |
| Uruguayans | 97.4 /100 | #98 | Exceptional 11.2% |
| Immigrants | Czechoslovakia | 97.4 /100 | #99 | Exceptional 11.2% |
| Immigrants | Greece | 96.9 /100 | #100 | Exceptional 11.3% |
| Immigrants | Nicaragua | 96.8 /100 | #101 | Exceptional 11.3% |
| Immigrants | Eastern Africa | 96.7 /100 | #102 | Exceptional 11.3% |
| Immigrants | Uruguay | 96.4 /100 | #103 | Exceptional 11.3% |
| Immigrants | Immigrants | 96.4 /100 | #104 | Exceptional 11.3% |
| Immigrants | Kazakhstan | 96.4 /100 | #105 | Exceptional 11.3% |
| Immigrants | Eastern Europe | 96.3 /100 | #106 | Exceptional 11.3% |
| Nicaraguans | 96.2 /100 | #107 | Exceptional 11.3% |
| Immigrants | Nigeria | 96.0 /100 | #108 | Exceptional 11.3% |
| Immigrants | Uganda | 95.7 /100 | #109 | Exceptional 11.3% |