Immigrants from Saudi Arabia vs Immigrants from Eastern Africa Disability
COMPARE
Immigrants from Saudi Arabia
Immigrants from Eastern Africa
Disability
Disability Comparison
Immigrants from Saudi Arabia
Immigrants from Eastern Africa
10.9%
DISABILITY
99.9/ 100
METRIC RATING
50th/ 347
METRIC RANK
11.3%
DISABILITY
96.7/ 100
METRIC RATING
102nd/ 347
METRIC RANK
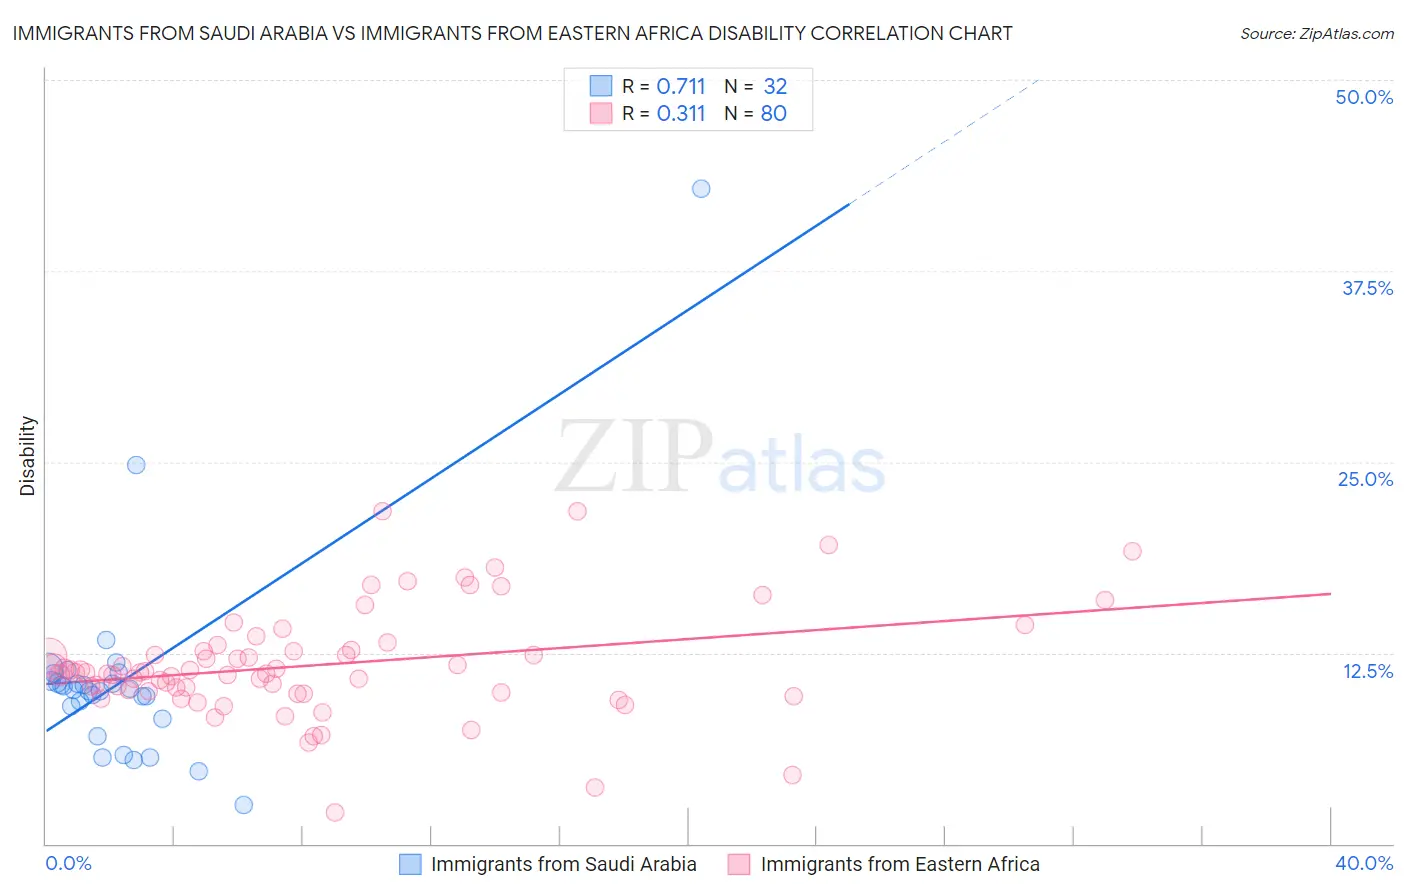
Immigrants from Saudi Arabia vs Immigrants from Eastern Africa Disability Correlation Chart
The statistical analysis conducted on geographies consisting of 164,295,639 people shows a strong positive correlation between the proportion of Immigrants from Saudi Arabia and percentage of population with a disability in the United States with a correlation coefficient (R) of 0.711 and weighted average of 10.9%. Similarly, the statistical analysis conducted on geographies consisting of 355,125,072 people shows a mild positive correlation between the proportion of Immigrants from Eastern Africa and percentage of population with a disability in the United States with a correlation coefficient (R) of 0.311 and weighted average of 11.3%, a difference of 3.7%.
Disability Correlation Summary
| Measurement | Immigrants from Saudi Arabia | Immigrants from Eastern Africa |
| Minimum | 2.6% | 2.1% |
| Maximum | 42.9% | 21.8% |
| Range | 40.3% | 19.7% |
| Mean | 10.8% | 11.7% |
| Median | 10.1% | 11.2% |
| Interquartile 25% (IQ1) | 8.6% | 10.0% |
| Interquartile 75% (IQ3) | 10.9% | 12.7% |
| Interquartile Range (IQR) | 2.3% | 2.7% |
| Standard Deviation (Sample) | 6.9% | 3.5% |
| Standard Deviation (Population) | 6.8% | 3.5% |
Similar Demographics by Disability
Demographics Similar to Immigrants from Saudi Arabia by Disability
In terms of disability, the demographic groups most similar to Immigrants from Saudi Arabia are Vietnamese (10.9%, a difference of 0.0%), Peruvian (10.9%, a difference of 0.010%), Soviet Union (10.9%, a difference of 0.060%), South American (10.9%, a difference of 0.070%), and Immigrants from Spain (10.9%, a difference of 0.090%).
| Demographics | Rating | Rank | Disability |
| Israelis | 99.9 /100 | #43 | Exceptional 10.8% |
| Immigrants | Japan | 99.9 /100 | #44 | Exceptional 10.8% |
| Immigrants | Peru | 99.9 /100 | #45 | Exceptional 10.8% |
| Tongans | 99.9 /100 | #46 | Exceptional 10.8% |
| Taiwanese | 99.9 /100 | #47 | Exceptional 10.8% |
| Soviet Union | 99.9 /100 | #48 | Exceptional 10.9% |
| Vietnamese | 99.9 /100 | #49 | Exceptional 10.9% |
| Immigrants | Saudi Arabia | 99.9 /100 | #50 | Exceptional 10.9% |
| Peruvians | 99.8 /100 | #51 | Exceptional 10.9% |
| South Americans | 99.8 /100 | #52 | Exceptional 10.9% |
| Immigrants | Spain | 99.8 /100 | #53 | Exceptional 10.9% |
| Jordanians | 99.8 /100 | #54 | Exceptional 10.9% |
| Immigrants | El Salvador | 99.8 /100 | #55 | Exceptional 10.9% |
| Immigrants | Lithuania | 99.8 /100 | #56 | Exceptional 10.9% |
| Salvadorans | 99.8 /100 | #57 | Exceptional 10.9% |
Demographics Similar to Immigrants from Eastern Africa by Disability
In terms of disability, the demographic groups most similar to Immigrants from Eastern Africa are Immigrants from Nicaragua (11.3%, a difference of 0.060%), Immigrants from Uruguay (11.3%, a difference of 0.070%), Immigrants (11.3%, a difference of 0.080%), Immigrants from Kazakhstan (11.3%, a difference of 0.090%), and Immigrants from Greece (11.3%, a difference of 0.11%).
| Demographics | Rating | Rank | Disability |
| Eastern Europeans | 97.8 /100 | #95 | Exceptional 11.2% |
| Immigrants | Zimbabwe | 97.7 /100 | #96 | Exceptional 11.2% |
| Bhutanese | 97.4 /100 | #97 | Exceptional 11.2% |
| Uruguayans | 97.4 /100 | #98 | Exceptional 11.2% |
| Immigrants | Czechoslovakia | 97.4 /100 | #99 | Exceptional 11.2% |
| Immigrants | Greece | 96.9 /100 | #100 | Exceptional 11.3% |
| Immigrants | Nicaragua | 96.8 /100 | #101 | Exceptional 11.3% |
| Immigrants | Eastern Africa | 96.7 /100 | #102 | Exceptional 11.3% |
| Immigrants | Uruguay | 96.4 /100 | #103 | Exceptional 11.3% |
| Immigrants | Immigrants | 96.4 /100 | #104 | Exceptional 11.3% |
| Immigrants | Kazakhstan | 96.4 /100 | #105 | Exceptional 11.3% |
| Immigrants | Eastern Europe | 96.3 /100 | #106 | Exceptional 11.3% |
| Nicaraguans | 96.2 /100 | #107 | Exceptional 11.3% |
| Immigrants | Nigeria | 96.0 /100 | #108 | Exceptional 11.3% |
| Immigrants | Uganda | 95.7 /100 | #109 | Exceptional 11.3% |