Nigerian vs Egyptian Disability
COMPARE
Nigerian
Egyptian
Disability
Disability Comparison
Nigerians
Egyptians
11.5%
DISABILITY
81.3/ 100
METRIC RATING
145th/ 347
METRIC RANK
10.6%
DISABILITY
100.0/ 100
METRIC RATING
28th/ 347
METRIC RANK
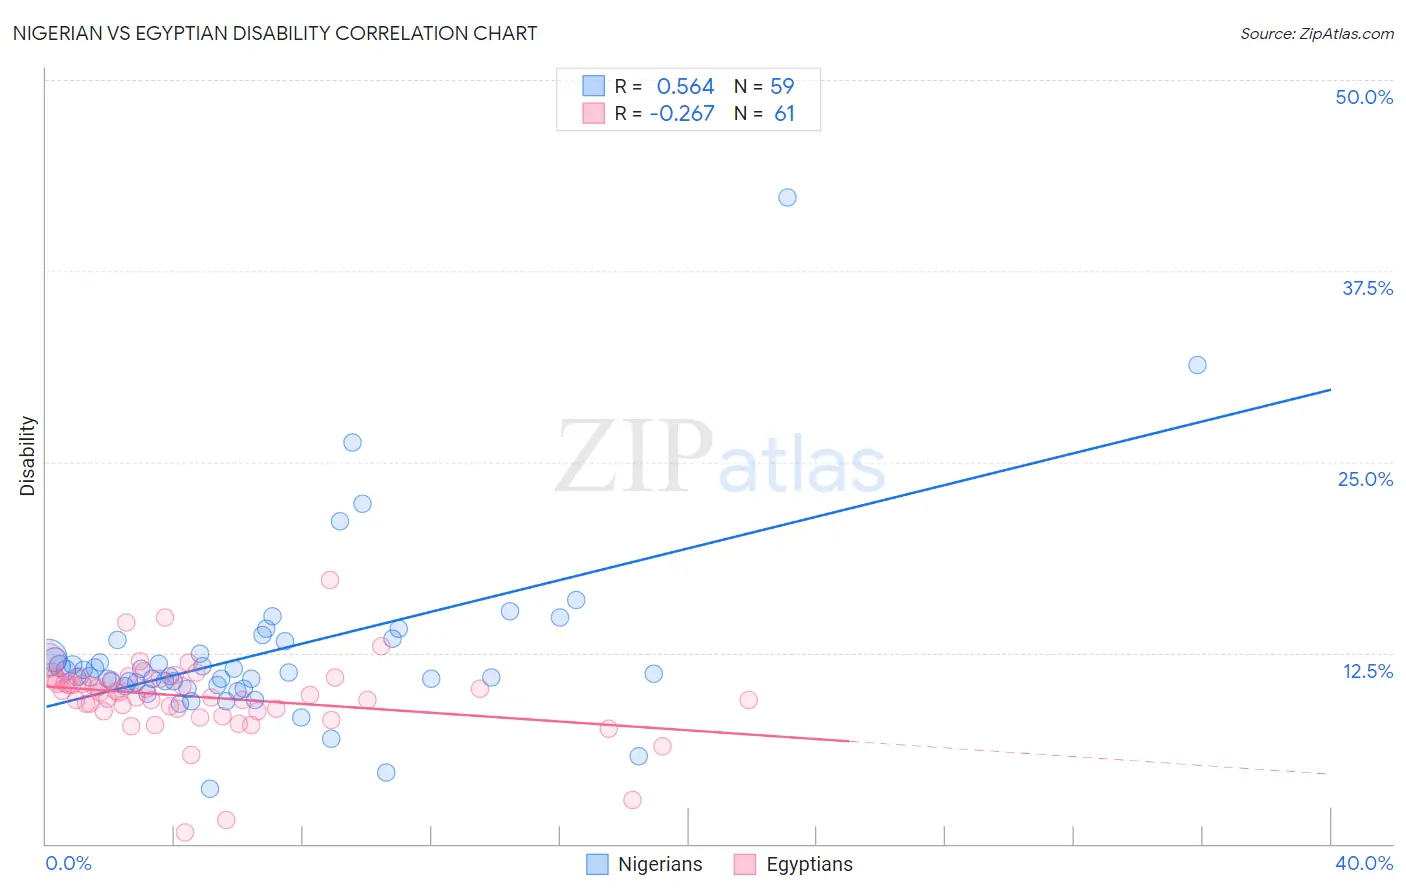
Nigerian vs Egyptian Disability Correlation Chart
The statistical analysis conducted on geographies consisting of 332,745,371 people shows a substantial positive correlation between the proportion of Nigerians and percentage of population with a disability in the United States with a correlation coefficient (R) of 0.564 and weighted average of 11.5%. Similarly, the statistical analysis conducted on geographies consisting of 276,915,962 people shows a weak negative correlation between the proportion of Egyptians and percentage of population with a disability in the United States with a correlation coefficient (R) of -0.267 and weighted average of 10.6%, a difference of 8.6%.
Disability Correlation Summary
| Measurement | Nigerian | Egyptian |
| Minimum | 3.6% | 0.75% |
| Maximum | 42.3% | 17.2% |
| Range | 38.7% | 16.5% |
| Mean | 12.5% | 9.6% |
| Median | 11.1% | 9.9% |
| Interquartile 25% (IQ1) | 10.4% | 8.8% |
| Interquartile 75% (IQ3) | 13.3% | 10.8% |
| Interquartile Range (IQR) | 2.9% | 2.0% |
| Standard Deviation (Sample) | 5.9% | 2.6% |
| Standard Deviation (Population) | 5.8% | 2.6% |
Similar Demographics by Disability
Demographics Similar to Nigerians by Disability
In terms of disability, the demographic groups most similar to Nigerians are Australian (11.5%, a difference of 0.090%), Moroccan (11.5%, a difference of 0.15%), Immigrants from Hungary (11.5%, a difference of 0.16%), Immigrants from Ukraine (11.5%, a difference of 0.26%), and Sudanese (11.5%, a difference of 0.29%).
| Demographics | Rating | Rank | Disability |
| New Zealanders | 87.0 /100 | #138 | Excellent 11.5% |
| Ghanaians | 87.0 /100 | #139 | Excellent 11.5% |
| Russians | 86.8 /100 | #140 | Excellent 11.5% |
| Immigrants | Grenada | 86.1 /100 | #141 | Excellent 11.5% |
| Immigrants | Sudan | 85.3 /100 | #142 | Excellent 11.5% |
| Moroccans | 83.3 /100 | #143 | Excellent 11.5% |
| Australians | 82.5 /100 | #144 | Excellent 11.5% |
| Nigerians | 81.3 /100 | #145 | Excellent 11.5% |
| Immigrants | Hungary | 79.0 /100 | #146 | Good 11.5% |
| Immigrants | Ukraine | 77.6 /100 | #147 | Good 11.5% |
| Sudanese | 77.1 /100 | #148 | Good 11.5% |
| Immigrants | Norway | 73.2 /100 | #149 | Good 11.6% |
| Romanians | 72.7 /100 | #150 | Good 11.6% |
| Immigrants | Kenya | 72.1 /100 | #151 | Good 11.6% |
| Immigrants | Moldova | 72.0 /100 | #152 | Good 11.6% |
Demographics Similar to Egyptians by Disability
In terms of disability, the demographic groups most similar to Egyptians are Cypriot (10.6%, a difference of 0.13%), Immigrants from Argentina (10.6%, a difference of 0.13%), Argentinean (10.6%, a difference of 0.14%), Immigrants from Malaysia (10.6%, a difference of 0.19%), and Immigrants from Turkey (10.6%, a difference of 0.28%).
| Demographics | Rating | Rank | Disability |
| Asians | 100.0 /100 | #21 | Exceptional 10.4% |
| Immigrants | Sri Lanka | 100.0 /100 | #22 | Exceptional 10.5% |
| Immigrants | Asia | 100.0 /100 | #23 | Exceptional 10.5% |
| Venezuelans | 100.0 /100 | #24 | Exceptional 10.5% |
| Immigrants | Malaysia | 100.0 /100 | #25 | Exceptional 10.6% |
| Argentineans | 100.0 /100 | #26 | Exceptional 10.6% |
| Cypriots | 100.0 /100 | #27 | Exceptional 10.6% |
| Egyptians | 100.0 /100 | #28 | Exceptional 10.6% |
| Immigrants | Argentina | 100.0 /100 | #29 | Exceptional 10.6% |
| Immigrants | Turkey | 100.0 /100 | #30 | Exceptional 10.6% |
| Immigrants | Egypt | 100.0 /100 | #31 | Exceptional 10.6% |
| Paraguayans | 100.0 /100 | #32 | Exceptional 10.6% |
| Immigrants | Kuwait | 100.0 /100 | #33 | Exceptional 10.7% |
| Immigrants | Ethiopia | 100.0 /100 | #34 | Exceptional 10.7% |
| Immigrants | Indonesia | 100.0 /100 | #35 | Exceptional 10.7% |