Native/Alaskan vs Pima Disability Age 35 to 64
COMPARE
Native/Alaskan
Pima
Disability Age 35 to 64
Disability Age 35 to 64 Comparison
Natives/Alaskans
Pima
15.3%
DISABILITY AGE 35 TO 64
0.0/ 100
METRIC RATING
326th/ 347
METRIC RANK
16.1%
DISABILITY AGE 35 TO 64
0.0/ 100
METRIC RATING
339th/ 347
METRIC RANK
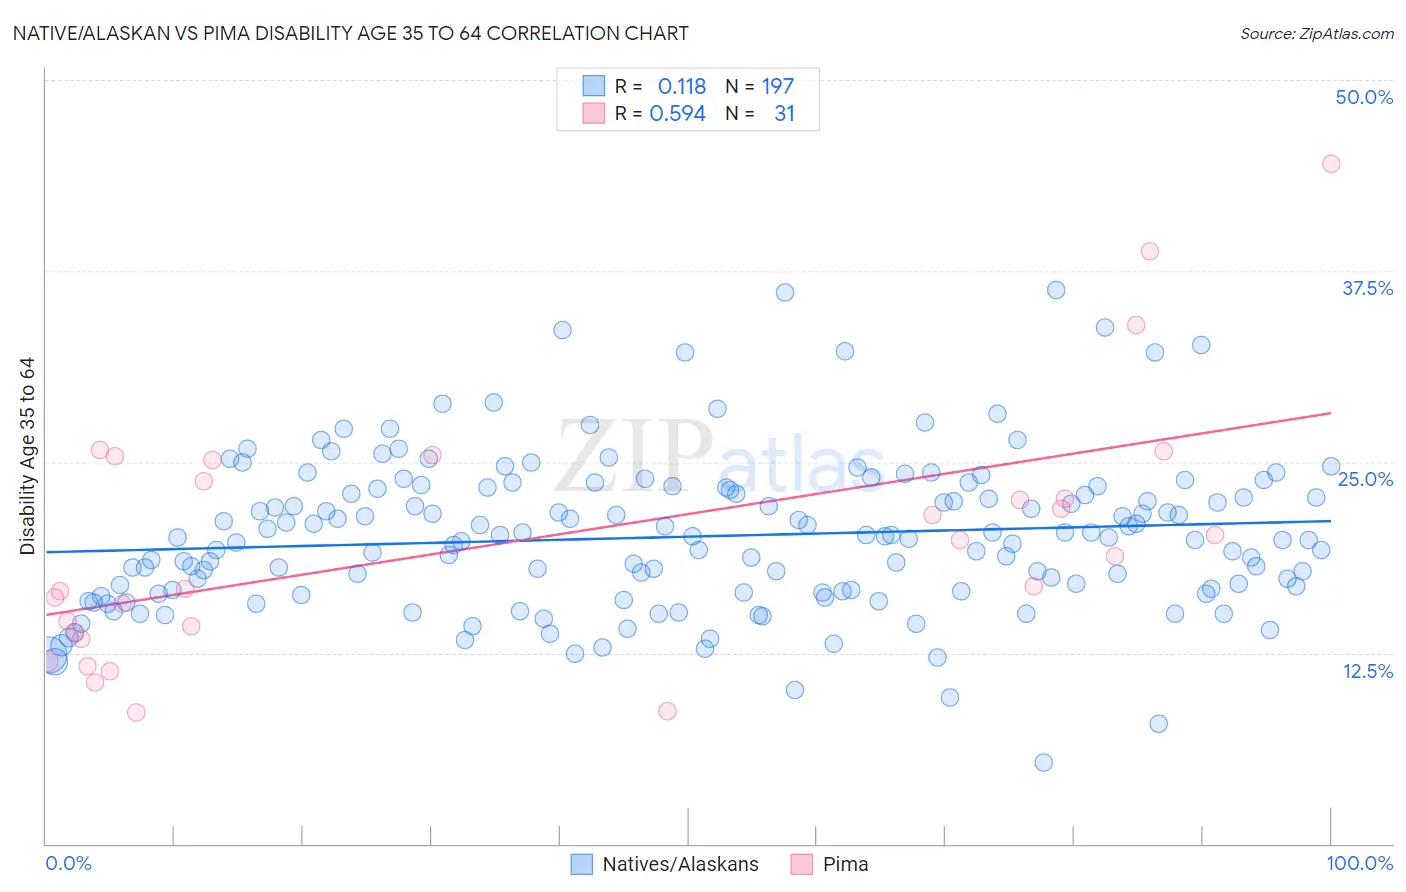
Native/Alaskan vs Pima Disability Age 35 to 64 Correlation Chart
The statistical analysis conducted on geographies consisting of 512,516,181 people shows a poor positive correlation between the proportion of Natives/Alaskans and percentage of population with a disability between the ages 34 and 64 in the United States with a correlation coefficient (R) of 0.118 and weighted average of 15.3%. Similarly, the statistical analysis conducted on geographies consisting of 61,540,994 people shows a substantial positive correlation between the proportion of Pima and percentage of population with a disability between the ages 34 and 64 in the United States with a correlation coefficient (R) of 0.594 and weighted average of 16.1%, a difference of 5.4%.
Disability Age 35 to 64 Correlation Summary
| Measurement | Native/Alaskan | Pima |
| Minimum | 5.3% | 8.6% |
| Maximum | 36.2% | 44.5% |
| Range | 31.0% | 35.9% |
| Mean | 20.1% | 19.9% |
| Median | 20.0% | 18.9% |
| Interquartile 25% (IQ1) | 16.5% | 13.8% |
| Interquartile 75% (IQ3) | 23.2% | 25.1% |
| Interquartile Range (IQR) | 6.7% | 11.3% |
| Standard Deviation (Sample) | 5.0% | 8.4% |
| Standard Deviation (Population) | 5.0% | 8.2% |
Demographics Similar to Natives/Alaskans and Pima by Disability Age 35 to 64
In terms of disability age 35 to 64, the demographic groups most similar to Natives/Alaskans are Pueblo (15.3%, a difference of 0.020%), Cajun (15.3%, a difference of 0.20%), Cherokee (15.5%, a difference of 0.95%), Navajo (15.5%, a difference of 1.2%), and Arapaho (15.1%, a difference of 1.6%). Similarly, the demographic groups most similar to Pima are Chickasaw (16.1%, a difference of 0.20%), Puerto Rican (15.9%, a difference of 1.2%), Menominee (15.9%, a difference of 1.6%), Choctaw (16.4%, a difference of 1.7%), and Seminole (15.9%, a difference of 1.8%).
| Demographics | Rating | Rank | Disability Age 35 to 64 |
| Potawatomi | 0.0 /100 | #322 | Tragic 14.8% |
| Apache | 0.0 /100 | #323 | Tragic 14.9% |
| Chippewa | 0.0 /100 | #324 | Tragic 15.0% |
| Arapaho | 0.0 /100 | #325 | Tragic 15.1% |
| Natives/Alaskans | 0.0 /100 | #326 | Tragic 15.3% |
| Pueblo | 0.0 /100 | #327 | Tragic 15.3% |
| Cajuns | 0.0 /100 | #328 | Tragic 15.3% |
| Cherokee | 0.0 /100 | #329 | Tragic 15.5% |
| Navajo | 0.0 /100 | #330 | Tragic 15.5% |
| Dutch West Indians | 0.0 /100 | #331 | Tragic 15.6% |
| Alaskan Athabascans | 0.0 /100 | #332 | Tragic 15.7% |
| Yuman | 0.0 /100 | #333 | Tragic 15.8% |
| Colville | 0.0 /100 | #334 | Tragic 15.8% |
| Seminole | 0.0 /100 | #335 | Tragic 15.9% |
| Menominee | 0.0 /100 | #336 | Tragic 15.9% |
| Puerto Ricans | 0.0 /100 | #337 | Tragic 15.9% |
| Chickasaw | 0.0 /100 | #338 | Tragic 16.1% |
| Pima | 0.0 /100 | #339 | Tragic 16.1% |
| Choctaw | 0.0 /100 | #340 | Tragic 16.4% |
| Tsimshian | 0.0 /100 | #341 | Tragic 16.7% |
| Tohono O'odham | 0.0 /100 | #342 | Tragic 16.7% |