Native/Alaskan vs Swedish Disability Age 35 to 64
COMPARE
Native/Alaskan
Swedish
Disability Age 35 to 64
Disability Age 35 to 64 Comparison
Natives/Alaskans
Swedes
15.3%
DISABILITY AGE 35 TO 64
0.0/ 100
METRIC RATING
326th/ 347
METRIC RANK
11.4%
DISABILITY AGE 35 TO 64
31.3/ 100
METRIC RATING
191st/ 347
METRIC RANK
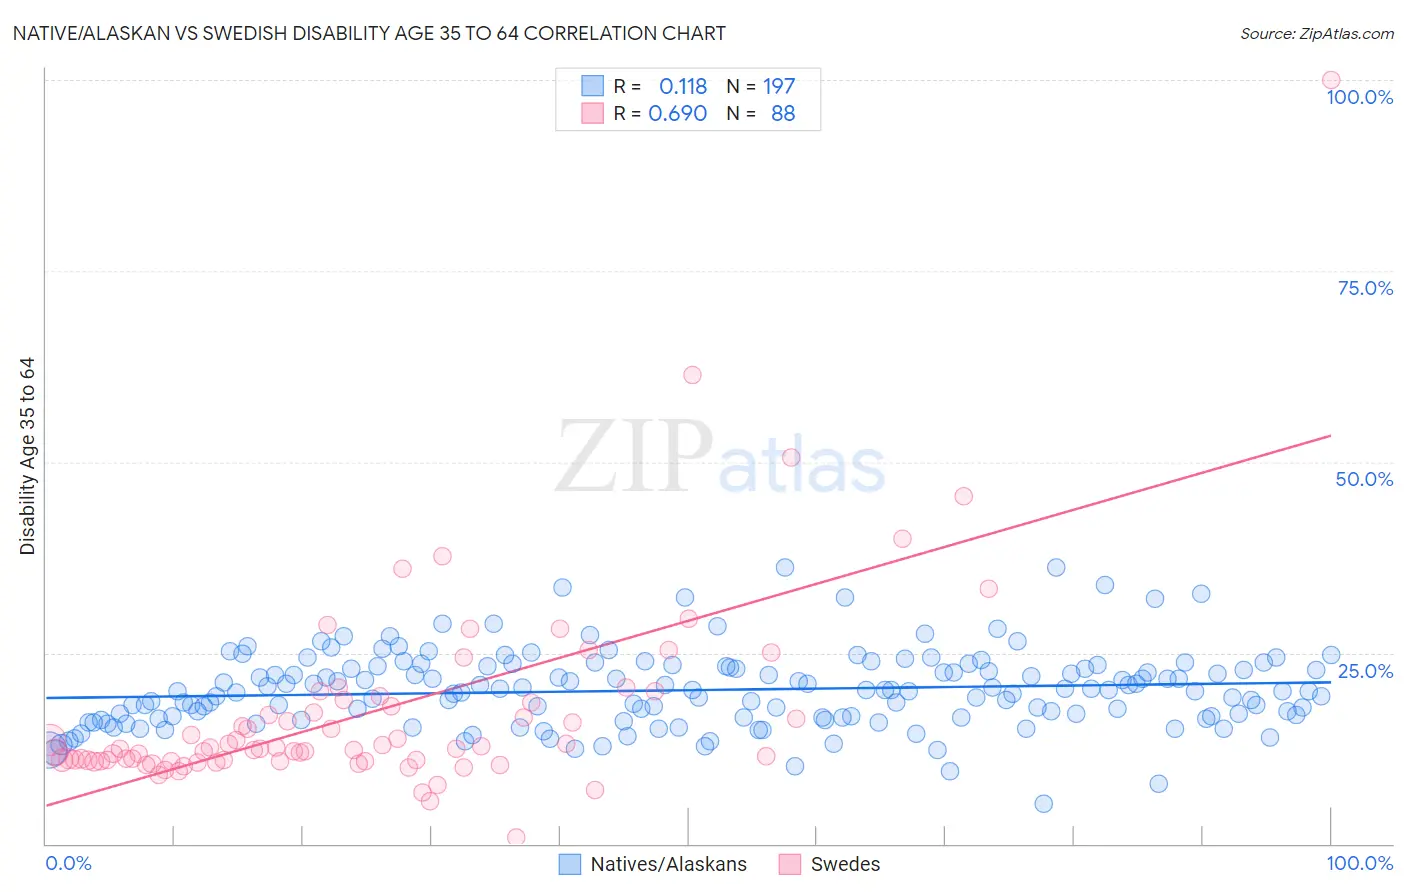
Native/Alaskan vs Swedish Disability Age 35 to 64 Correlation Chart
The statistical analysis conducted on geographies consisting of 512,516,181 people shows a poor positive correlation between the proportion of Natives/Alaskans and percentage of population with a disability between the ages 34 and 64 in the United States with a correlation coefficient (R) of 0.118 and weighted average of 15.3%. Similarly, the statistical analysis conducted on geographies consisting of 538,454,121 people shows a significant positive correlation between the proportion of Swedes and percentage of population with a disability between the ages 34 and 64 in the United States with a correlation coefficient (R) of 0.690 and weighted average of 11.4%, a difference of 33.7%.
Disability Age 35 to 64 Correlation Summary
| Measurement | Native/Alaskan | Swedish |
| Minimum | 5.3% | 0.77% |
| Maximum | 36.2% | 100.0% |
| Range | 31.0% | 99.2% |
| Mean | 20.1% | 17.3% |
| Median | 20.0% | 12.5% |
| Interquartile 25% (IQ1) | 16.5% | 10.9% |
| Interquartile 75% (IQ3) | 23.2% | 18.6% |
| Interquartile Range (IQR) | 6.7% | 7.7% |
| Standard Deviation (Sample) | 5.0% | 13.3% |
| Standard Deviation (Population) | 5.0% | 13.3% |
Similar Demographics by Disability Age 35 to 64
Demographics Similar to Natives/Alaskans by Disability Age 35 to 64
In terms of disability age 35 to 64, the demographic groups most similar to Natives/Alaskans are Pueblo (15.3%, a difference of 0.020%), Cajun (15.3%, a difference of 0.20%), Cherokee (15.5%, a difference of 0.95%), Navajo (15.5%, a difference of 1.2%), and Arapaho (15.1%, a difference of 1.6%).
| Demographics | Rating | Rank | Disability Age 35 to 64 |
| Immigrants | Cabo Verde | 0.0 /100 | #319 | Tragic 14.7% |
| Blacks/African Americans | 0.0 /100 | #320 | Tragic 14.7% |
| Comanche | 0.0 /100 | #321 | Tragic 14.7% |
| Potawatomi | 0.0 /100 | #322 | Tragic 14.8% |
| Apache | 0.0 /100 | #323 | Tragic 14.9% |
| Chippewa | 0.0 /100 | #324 | Tragic 15.0% |
| Arapaho | 0.0 /100 | #325 | Tragic 15.1% |
| Natives/Alaskans | 0.0 /100 | #326 | Tragic 15.3% |
| Pueblo | 0.0 /100 | #327 | Tragic 15.3% |
| Cajuns | 0.0 /100 | #328 | Tragic 15.3% |
| Cherokee | 0.0 /100 | #329 | Tragic 15.5% |
| Navajo | 0.0 /100 | #330 | Tragic 15.5% |
| Dutch West Indians | 0.0 /100 | #331 | Tragic 15.6% |
| Alaskan Athabascans | 0.0 /100 | #332 | Tragic 15.7% |
| Yuman | 0.0 /100 | #333 | Tragic 15.8% |
Demographics Similar to Swedes by Disability Age 35 to 64
In terms of disability age 35 to 64, the demographic groups most similar to Swedes are Immigrants from Nigeria (11.4%, a difference of 0.11%), Norwegian (11.5%, a difference of 0.15%), Immigrants from Africa (11.5%, a difference of 0.22%), Hungarian (11.4%, a difference of 0.30%), and Northern European (11.4%, a difference of 0.32%).
| Demographics | Rating | Rank | Disability Age 35 to 64 |
| Kenyans | 39.2 /100 | #184 | Fair 11.4% |
| Danes | 36.8 /100 | #185 | Fair 11.4% |
| Slovenes | 36.6 /100 | #186 | Fair 11.4% |
| Immigrants | Bosnia and Herzegovina | 35.2 /100 | #187 | Fair 11.4% |
| Northern Europeans | 34.9 /100 | #188 | Fair 11.4% |
| Hungarians | 34.6 /100 | #189 | Fair 11.4% |
| Immigrants | Nigeria | 32.5 /100 | #190 | Fair 11.4% |
| Swedes | 31.3 /100 | #191 | Fair 11.4% |
| Norwegians | 29.7 /100 | #192 | Fair 11.5% |
| Immigrants | Africa | 29.0 /100 | #193 | Fair 11.5% |
| Immigrants | Latin America | 27.5 /100 | #194 | Fair 11.5% |
| Carpatho Rusyns | 25.3 /100 | #195 | Fair 11.5% |
| Iraqis | 24.2 /100 | #196 | Fair 11.5% |
| Immigrants | Iraq | 21.0 /100 | #197 | Fair 11.6% |
| Immigrants | Panama | 20.4 /100 | #198 | Fair 11.6% |