Marshallese vs Lebanese Disability Age 5 to 17
COMPARE
Marshallese
Lebanese
Disability Age 5 to 17
Disability Age 5 to 17 Comparison
Marshallese
Lebanese
5.7%
DISABILITY AGE 5 TO 17
28.1/ 100
METRIC RATING
188th/ 347
METRIC RANK
5.6%
DISABILITY AGE 5 TO 17
61.4/ 100
METRIC RATING
165th/ 347
METRIC RANK
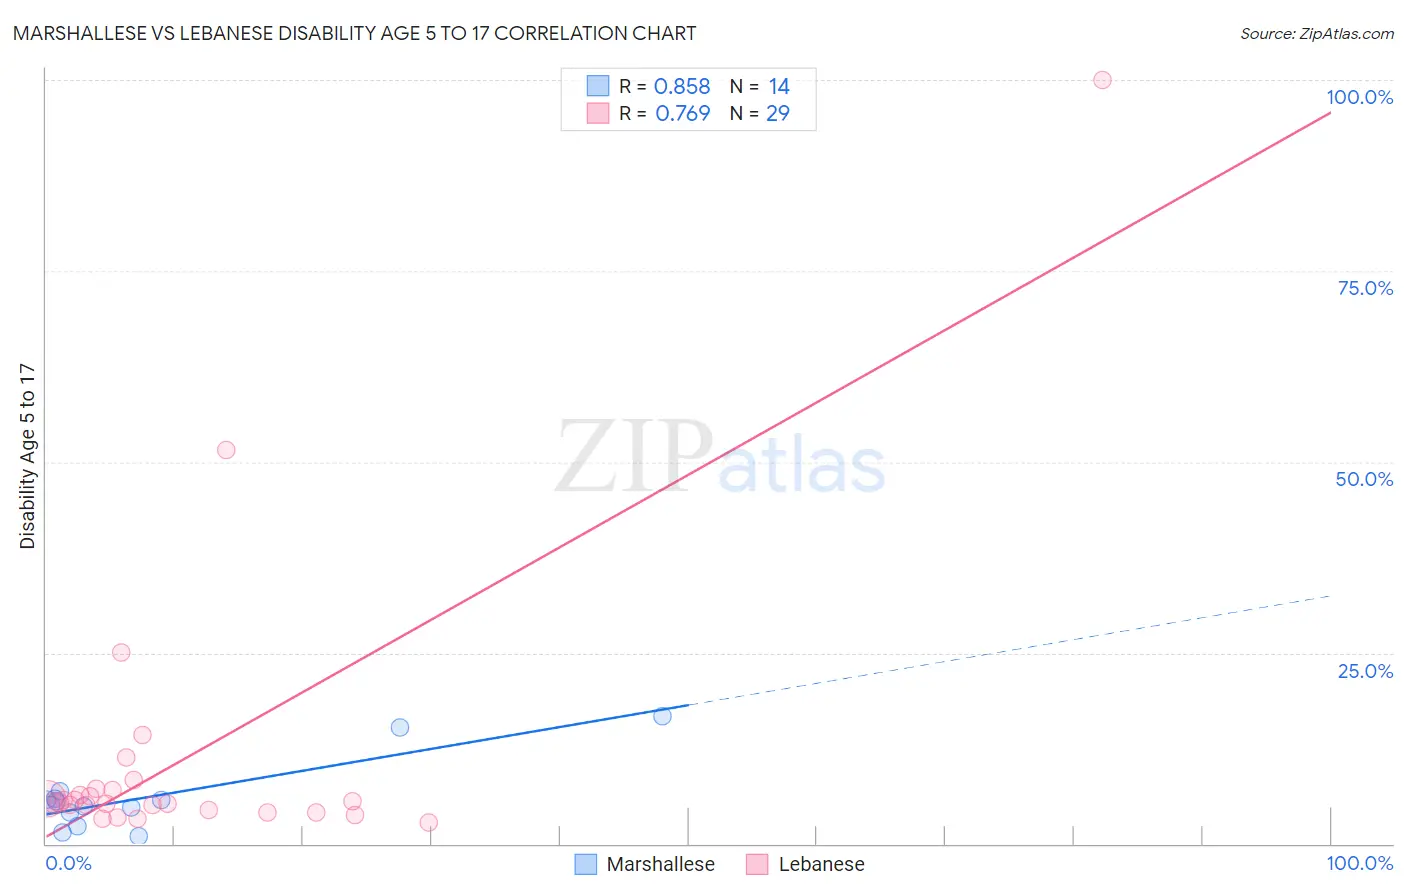
Marshallese vs Lebanese Disability Age 5 to 17 Correlation Chart
The statistical analysis conducted on geographies consisting of 14,753,220 people shows a very strong positive correlation between the proportion of Marshallese and percentage of population with a disability between the ages 5 and 17 in the United States with a correlation coefficient (R) of 0.858 and weighted average of 5.7%. Similarly, the statistical analysis conducted on geographies consisting of 398,034,375 people shows a strong positive correlation between the proportion of Lebanese and percentage of population with a disability between the ages 5 and 17 in the United States with a correlation coefficient (R) of 0.769 and weighted average of 5.6%, a difference of 1.7%.
Disability Age 5 to 17 Correlation Summary
| Measurement | Marshallese | Lebanese |
| Minimum | 0.94% | 2.9% |
| Maximum | 16.7% | 100.0% |
| Range | 15.7% | 97.1% |
| Mean | 6.1% | 11.2% |
| Median | 5.3% | 5.4% |
| Interquartile 25% (IQ1) | 4.1% | 4.3% |
| Interquartile 75% (IQ3) | 5.9% | 7.1% |
| Interquartile Range (IQR) | 1.8% | 2.8% |
| Standard Deviation (Sample) | 4.5% | 19.5% |
| Standard Deviation (Population) | 4.4% | 19.1% |
Similar Demographics by Disability Age 5 to 17
Demographics Similar to Marshallese by Disability Age 5 to 17
In terms of disability age 5 to 17, the demographic groups most similar to Marshallese are Pueblo (5.7%, a difference of 0.040%), Immigrants from Eastern Africa (5.7%, a difference of 0.050%), Danish (5.7%, a difference of 0.10%), Immigrants from Bosnia and Herzegovina (5.7%, a difference of 0.11%), and Immigrants from Thailand (5.7%, a difference of 0.12%).
| Demographics | Rating | Rank | Disability Age 5 to 17 |
| Immigrants | England | 36.4 /100 | #181 | Fair 5.6% |
| Mexican American Indians | 35.2 /100 | #182 | Fair 5.6% |
| Immigrants | Latin America | 34.3 /100 | #183 | Fair 5.6% |
| Syrians | 33.8 /100 | #184 | Fair 5.6% |
| Immigrants | Mexico | 33.7 /100 | #185 | Fair 5.6% |
| Fijians | 31.7 /100 | #186 | Fair 5.7% |
| Immigrants | Thailand | 30.2 /100 | #187 | Fair 5.7% |
| Marshallese | 28.1 /100 | #188 | Fair 5.7% |
| Pueblo | 27.5 /100 | #189 | Fair 5.7% |
| Immigrants | Eastern Africa | 27.3 /100 | #190 | Fair 5.7% |
| Danes | 26.5 /100 | #191 | Fair 5.7% |
| Immigrants | Bosnia and Herzegovina | 26.3 /100 | #192 | Fair 5.7% |
| Immigrants | Canada | 26.1 /100 | #193 | Fair 5.7% |
| Croatians | 23.6 /100 | #194 | Fair 5.7% |
| Immigrants | Nigeria | 23.4 /100 | #195 | Fair 5.7% |
Demographics Similar to Lebanese by Disability Age 5 to 17
In terms of disability age 5 to 17, the demographic groups most similar to Lebanese are Immigrants from Scotland (5.6%, a difference of 0.030%), Greek (5.6%, a difference of 0.040%), Immigrants from Burma/Myanmar (5.6%, a difference of 0.11%), Immigrants from Southern Europe (5.6%, a difference of 0.14%), and Iraqi (5.6%, a difference of 0.27%).
| Demographics | Rating | Rank | Disability Age 5 to 17 |
| Immigrants | Nepal | 77.1 /100 | #158 | Good 5.5% |
| Immigrants | Zimbabwe | 75.3 /100 | #159 | Good 5.5% |
| South Africans | 73.3 /100 | #160 | Good 5.5% |
| Immigrants | Saudi Arabia | 69.1 /100 | #161 | Good 5.5% |
| Zimbabweans | 67.2 /100 | #162 | Good 5.5% |
| Immigrants | Southern Europe | 64.0 /100 | #163 | Good 5.6% |
| Immigrants | Scotland | 61.9 /100 | #164 | Good 5.6% |
| Lebanese | 61.4 /100 | #165 | Good 5.6% |
| Greeks | 60.6 /100 | #166 | Good 5.6% |
| Immigrants | Burma/Myanmar | 59.3 /100 | #167 | Average 5.6% |
| Iraqis | 56.0 /100 | #168 | Average 5.6% |
| Immigrants | Norway | 55.7 /100 | #169 | Average 5.6% |
| Serbians | 54.0 /100 | #170 | Average 5.6% |
| Immigrants | Iraq | 53.9 /100 | #171 | Average 5.6% |
| Ukrainians | 51.5 /100 | #172 | Average 5.6% |