Yakama vs Lebanese Disability Age 5 to 17
COMPARE
Yakama
Lebanese
Disability Age 5 to 17
Disability Age 5 to 17 Comparison
Yakama
Lebanese
6.3%
DISABILITY AGE 5 TO 17
0.0/ 100
METRIC RATING
303rd/ 347
METRIC RANK
5.6%
DISABILITY AGE 5 TO 17
61.4/ 100
METRIC RATING
165th/ 347
METRIC RANK
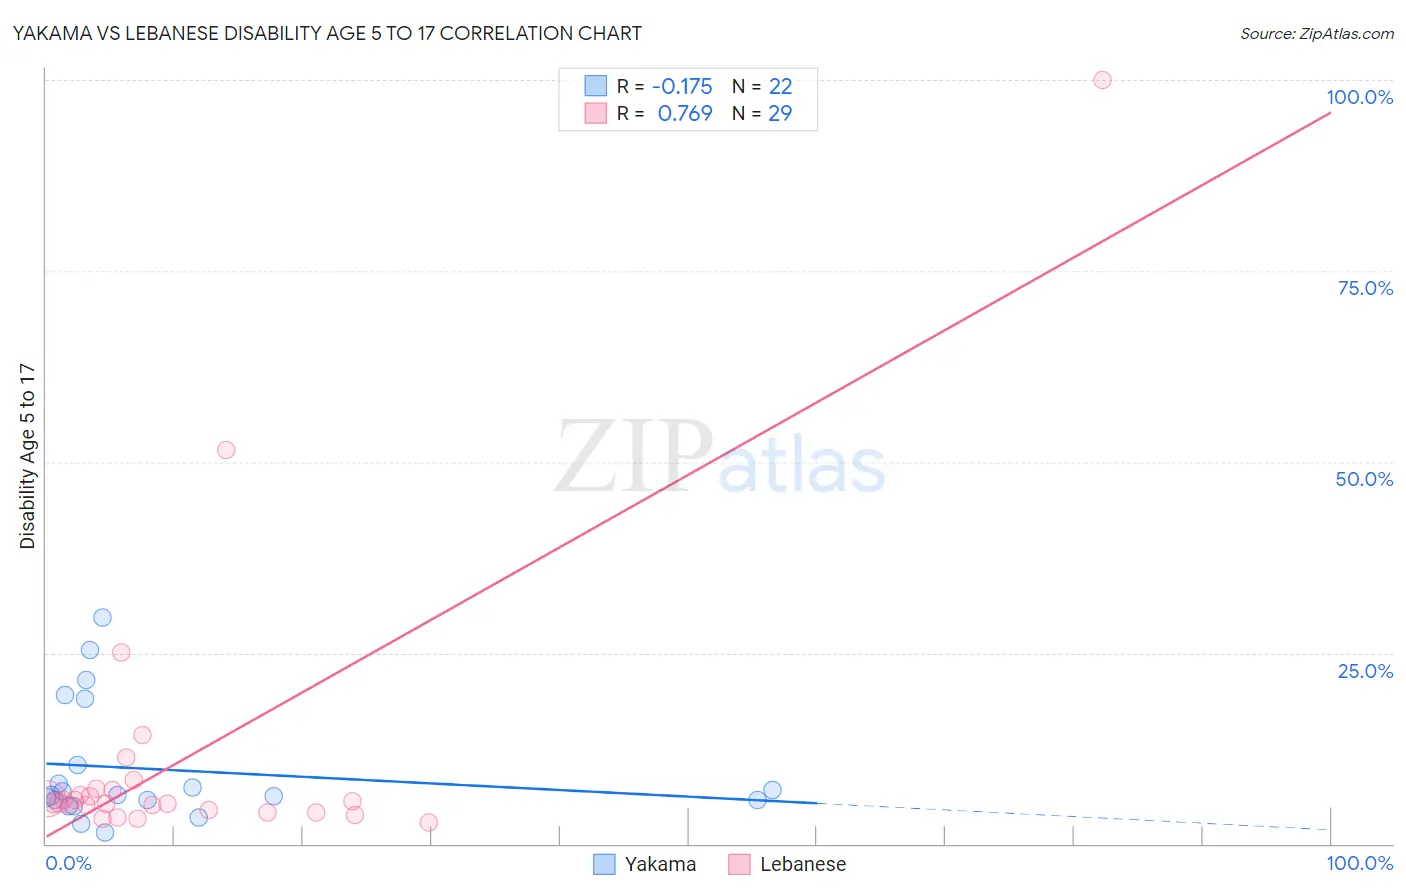
Yakama vs Lebanese Disability Age 5 to 17 Correlation Chart
The statistical analysis conducted on geographies consisting of 19,874,624 people shows a poor negative correlation between the proportion of Yakama and percentage of population with a disability between the ages 5 and 17 in the United States with a correlation coefficient (R) of -0.175 and weighted average of 6.3%. Similarly, the statistical analysis conducted on geographies consisting of 398,034,375 people shows a strong positive correlation between the proportion of Lebanese and percentage of population with a disability between the ages 5 and 17 in the United States with a correlation coefficient (R) of 0.769 and weighted average of 5.6%, a difference of 13.0%.
Disability Age 5 to 17 Correlation Summary
| Measurement | Yakama | Lebanese |
| Minimum | 1.4% | 2.9% |
| Maximum | 29.6% | 100.0% |
| Range | 28.2% | 97.1% |
| Mean | 9.7% | 11.2% |
| Median | 6.4% | 5.4% |
| Interquartile 25% (IQ1) | 5.7% | 4.3% |
| Interquartile 75% (IQ3) | 10.3% | 7.1% |
| Interquartile Range (IQR) | 4.6% | 2.8% |
| Standard Deviation (Sample) | 7.8% | 19.5% |
| Standard Deviation (Population) | 7.6% | 19.1% |
Similar Demographics by Disability Age 5 to 17
Demographics Similar to Yakama by Disability Age 5 to 17
In terms of disability age 5 to 17, the demographic groups most similar to Yakama are Senegalese (6.3%, a difference of 0.080%), Celtic (6.3%, a difference of 0.10%), Native/Alaskan (6.3%, a difference of 0.22%), Nonimmigrants (6.3%, a difference of 0.32%), and U.S. Virgin Islander (6.3%, a difference of 0.43%).
| Demographics | Rating | Rank | Disability Age 5 to 17 |
| Spanish Americans | 0.0 /100 | #296 | Tragic 6.2% |
| Immigrants | Bahamas | 0.0 /100 | #297 | Tragic 6.2% |
| Lumbee | 0.0 /100 | #298 | Tragic 6.2% |
| Welsh | 0.0 /100 | #299 | Tragic 6.3% |
| Carpatho Rusyns | 0.0 /100 | #300 | Tragic 6.3% |
| U.S. Virgin Islanders | 0.0 /100 | #301 | Tragic 6.3% |
| Celtics | 0.0 /100 | #302 | Tragic 6.3% |
| Yakama | 0.0 /100 | #303 | Tragic 6.3% |
| Senegalese | 0.0 /100 | #304 | Tragic 6.3% |
| Natives/Alaskans | 0.0 /100 | #305 | Tragic 6.3% |
| Immigrants | Nonimmigrants | 0.0 /100 | #306 | Tragic 6.3% |
| Bahamians | 0.0 /100 | #307 | Tragic 6.3% |
| Scotch-Irish | 0.0 /100 | #308 | Tragic 6.3% |
| Hmong | 0.0 /100 | #309 | Tragic 6.3% |
| Alaskan Athabascans | 0.0 /100 | #310 | Tragic 6.3% |
Demographics Similar to Lebanese by Disability Age 5 to 17
In terms of disability age 5 to 17, the demographic groups most similar to Lebanese are Immigrants from Scotland (5.6%, a difference of 0.030%), Greek (5.6%, a difference of 0.040%), Immigrants from Burma/Myanmar (5.6%, a difference of 0.11%), Immigrants from Southern Europe (5.6%, a difference of 0.14%), and Iraqi (5.6%, a difference of 0.27%).
| Demographics | Rating | Rank | Disability Age 5 to 17 |
| Immigrants | Nepal | 77.1 /100 | #158 | Good 5.5% |
| Immigrants | Zimbabwe | 75.3 /100 | #159 | Good 5.5% |
| South Africans | 73.3 /100 | #160 | Good 5.5% |
| Immigrants | Saudi Arabia | 69.1 /100 | #161 | Good 5.5% |
| Zimbabweans | 67.2 /100 | #162 | Good 5.5% |
| Immigrants | Southern Europe | 64.0 /100 | #163 | Good 5.6% |
| Immigrants | Scotland | 61.9 /100 | #164 | Good 5.6% |
| Lebanese | 61.4 /100 | #165 | Good 5.6% |
| Greeks | 60.6 /100 | #166 | Good 5.6% |
| Immigrants | Burma/Myanmar | 59.3 /100 | #167 | Average 5.6% |
| Iraqis | 56.0 /100 | #168 | Average 5.6% |
| Immigrants | Norway | 55.7 /100 | #169 | Average 5.6% |
| Serbians | 54.0 /100 | #170 | Average 5.6% |
| Immigrants | Iraq | 53.9 /100 | #171 | Average 5.6% |
| Ukrainians | 51.5 /100 | #172 | Average 5.6% |