Iroquois vs Immigrants from Turkey Female Disability
COMPARE
Iroquois
Immigrants from Turkey
Female Disability
Female Disability Comparison
Iroquois
Immigrants from Turkey
14.0%
FEMALE DISABILITY
0.0/ 100
METRIC RATING
319th/ 347
METRIC RANK
11.1%
FEMALE DISABILITY
100.0/ 100
METRIC RATING
27th/ 347
METRIC RANK
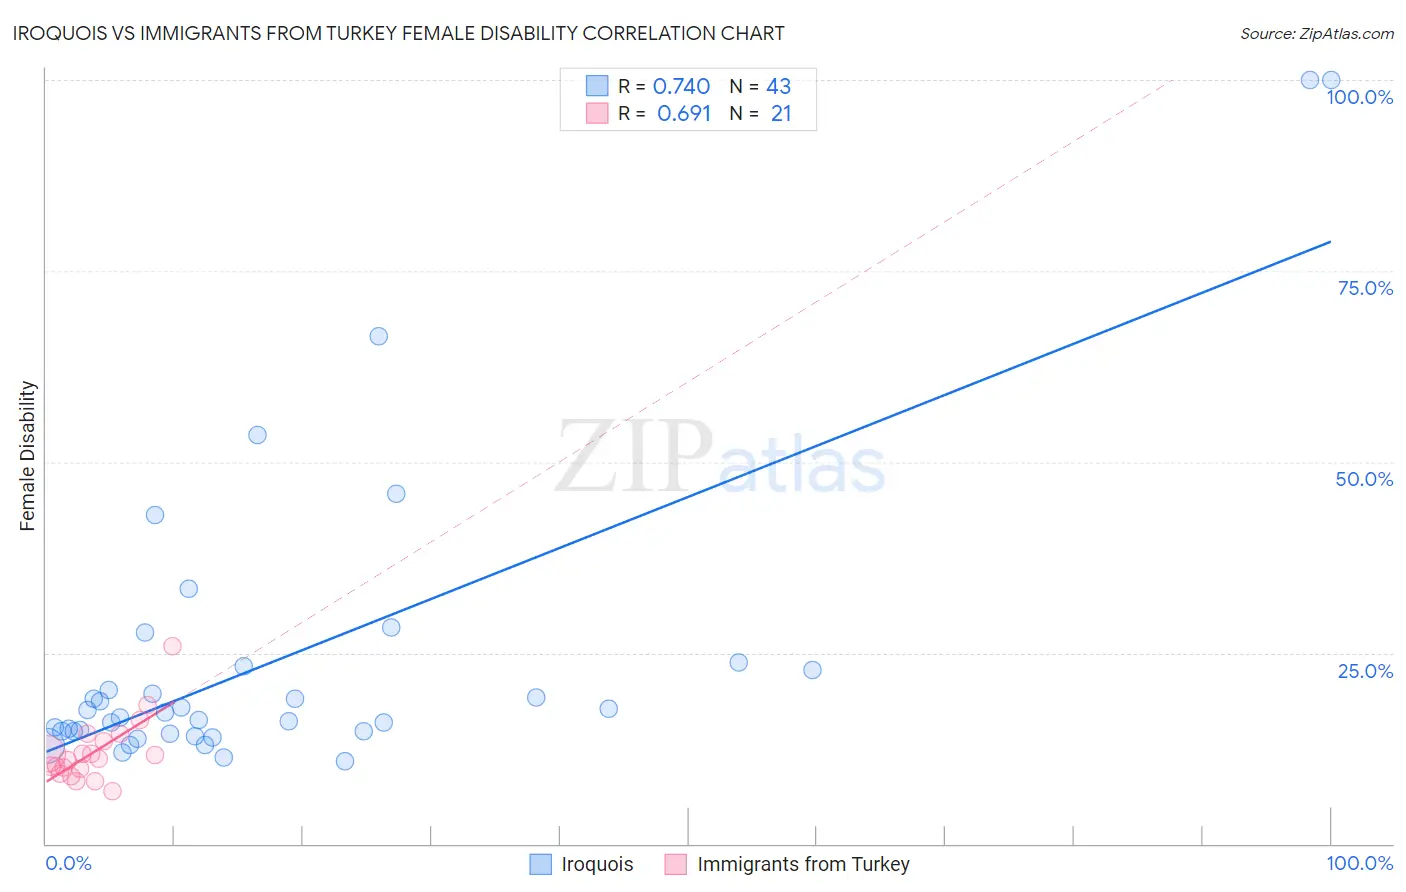
Iroquois vs Immigrants from Turkey Female Disability Correlation Chart
The statistical analysis conducted on geographies consisting of 207,273,791 people shows a strong positive correlation between the proportion of Iroquois and percentage of females with a disability in the United States with a correlation coefficient (R) of 0.740 and weighted average of 14.0%. Similarly, the statistical analysis conducted on geographies consisting of 223,044,137 people shows a significant positive correlation between the proportion of Immigrants from Turkey and percentage of females with a disability in the United States with a correlation coefficient (R) of 0.691 and weighted average of 11.1%, a difference of 27.0%.
Female Disability Correlation Summary
| Measurement | Iroquois | Immigrants from Turkey |
| Minimum | 10.9% | 6.9% |
| Maximum | 100.0% | 25.9% |
| Range | 89.1% | 19.0% |
| Mean | 24.5% | 12.0% |
| Median | 17.2% | 11.2% |
| Interquartile 25% (IQ1) | 14.7% | 9.5% |
| Interquartile 75% (IQ3) | 23.2% | 13.9% |
| Interquartile Range (IQR) | 8.6% | 4.5% |
| Standard Deviation (Sample) | 20.4% | 4.2% |
| Standard Deviation (Population) | 20.2% | 4.1% |
Similar Demographics by Female Disability
Demographics Similar to Iroquois by Female Disability
In terms of female disability, the demographic groups most similar to Iroquois are Paiute (14.0%, a difference of 0.29%), American (14.1%, a difference of 0.34%), Chippewa (14.0%, a difference of 0.40%), Potawatomi (14.1%, a difference of 0.48%), and Pueblo (14.1%, a difference of 0.49%).
| Demographics | Rating | Rank | Female Disability |
| Delaware | 0.0 /100 | #312 | Tragic 13.8% |
| Blackfeet | 0.0 /100 | #313 | Tragic 13.8% |
| Puget Sound Salish | 0.0 /100 | #314 | Tragic 13.8% |
| Alaskan Athabascans | 0.0 /100 | #315 | Tragic 13.9% |
| Spanish Americans | 0.0 /100 | #316 | Tragic 14.0% |
| Chippewa | 0.0 /100 | #317 | Tragic 14.0% |
| Paiute | 0.0 /100 | #318 | Tragic 14.0% |
| Iroquois | 0.0 /100 | #319 | Tragic 14.0% |
| Americans | 0.0 /100 | #320 | Tragic 14.1% |
| Potawatomi | 0.0 /100 | #321 | Tragic 14.1% |
| Pueblo | 0.0 /100 | #322 | Tragic 14.1% |
| Blacks/African Americans | 0.0 /100 | #323 | Tragic 14.1% |
| Natives/Alaskans | 0.0 /100 | #324 | Tragic 14.1% |
| Navajo | 0.0 /100 | #325 | Tragic 14.2% |
| Comanche | 0.0 /100 | #326 | Tragic 14.2% |
Demographics Similar to Immigrants from Turkey by Female Disability
In terms of female disability, the demographic groups most similar to Immigrants from Turkey are Egyptian (11.1%, a difference of 0.27%), Immigrants from Malaysia (11.1%, a difference of 0.34%), Turkish (11.1%, a difference of 0.34%), Argentinean (11.0%, a difference of 0.40%), and Immigrants from Asia (11.0%, a difference of 0.44%).
| Demographics | Rating | Rank | Female Disability |
| Immigrants | Pakistan | 100.0 /100 | #20 | Exceptional 10.9% |
| Asians | 100.0 /100 | #21 | Exceptional 10.9% |
| Immigrants | Sri Lanka | 100.0 /100 | #22 | Exceptional 10.9% |
| Venezuelans | 100.0 /100 | #23 | Exceptional 11.0% |
| Immigrants | Argentina | 100.0 /100 | #24 | Exceptional 11.0% |
| Immigrants | Asia | 100.0 /100 | #25 | Exceptional 11.0% |
| Argentineans | 100.0 /100 | #26 | Exceptional 11.0% |
| Immigrants | Turkey | 100.0 /100 | #27 | Exceptional 11.1% |
| Egyptians | 100.0 /100 | #28 | Exceptional 11.1% |
| Immigrants | Malaysia | 100.0 /100 | #29 | Exceptional 11.1% |
| Turks | 100.0 /100 | #30 | Exceptional 11.1% |
| Immigrants | Kuwait | 100.0 /100 | #31 | Exceptional 11.1% |
| Immigrants | Australia | 100.0 /100 | #32 | Exceptional 11.1% |
| Immigrants | Egypt | 100.0 /100 | #33 | Exceptional 11.1% |
| Immigrants | Indonesia | 100.0 /100 | #34 | Exceptional 11.2% |