Iroquois vs Immigrants from Jamaica Disability Age 5 to 17
COMPARE
Iroquois
Immigrants from Jamaica
Disability Age 5 to 17
Disability Age 5 to 17 Comparison
Iroquois
Immigrants from Jamaica
6.9%
DISABILITY AGE 5 TO 17
0.0/ 100
METRIC RATING
338th/ 347
METRIC RANK
6.1%
DISABILITY AGE 5 TO 17
0.1/ 100
METRIC RATING
279th/ 347
METRIC RANK
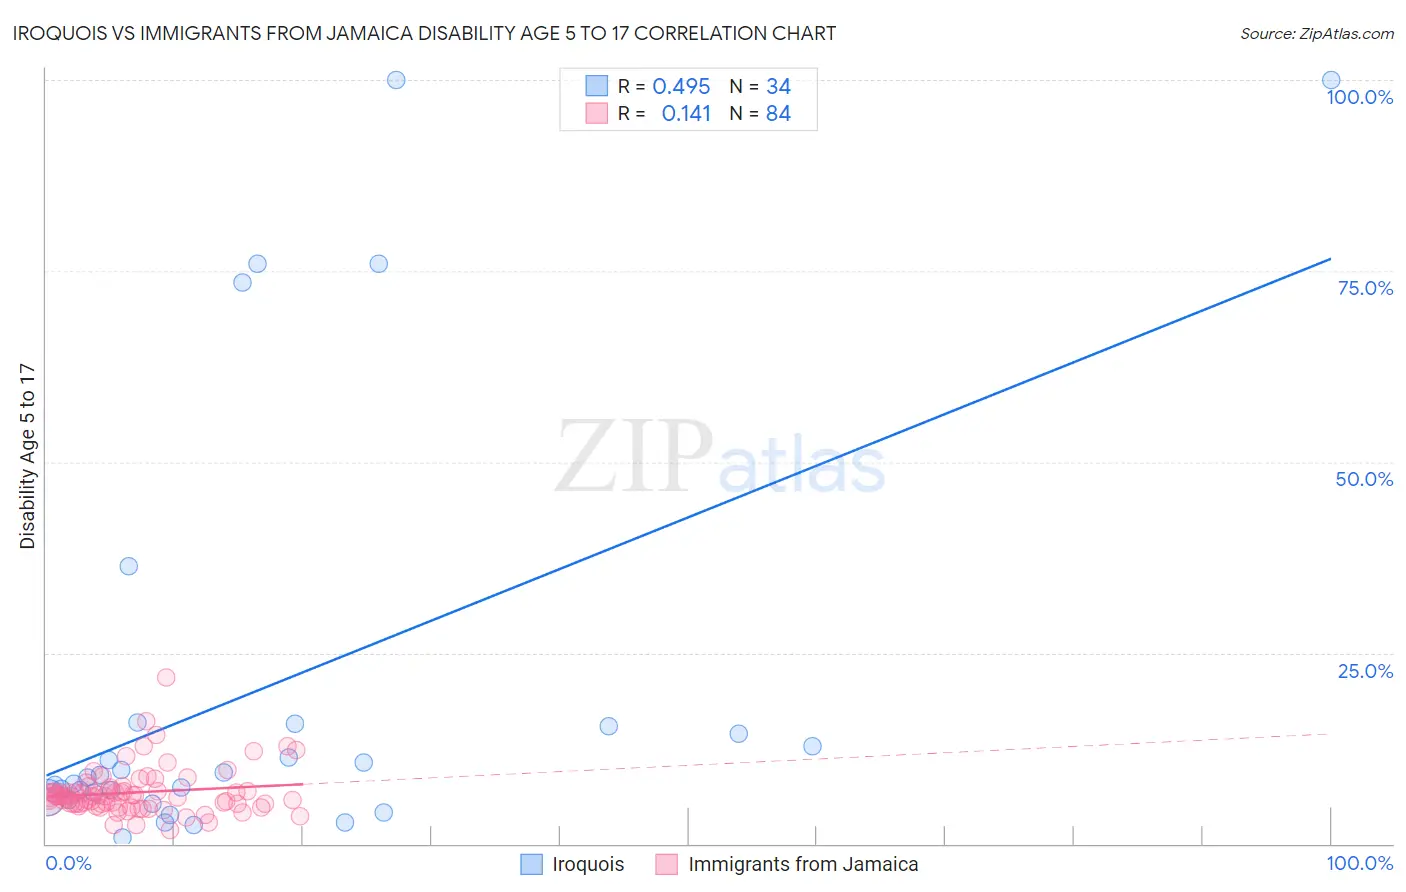
Iroquois vs Immigrants from Jamaica Disability Age 5 to 17 Correlation Chart
The statistical analysis conducted on geographies consisting of 206,302,830 people shows a moderate positive correlation between the proportion of Iroquois and percentage of population with a disability between the ages 5 and 17 in the United States with a correlation coefficient (R) of 0.495 and weighted average of 6.9%. Similarly, the statistical analysis conducted on geographies consisting of 299,987,065 people shows a poor positive correlation between the proportion of Immigrants from Jamaica and percentage of population with a disability between the ages 5 and 17 in the United States with a correlation coefficient (R) of 0.141 and weighted average of 6.1%, a difference of 12.7%.
Disability Age 5 to 17 Correlation Summary
| Measurement | Iroquois | Immigrants from Jamaica |
| Minimum | 0.85% | 1.8% |
| Maximum | 100.0% | 21.8% |
| Range | 99.1% | 20.0% |
| Mean | 20.3% | 6.7% |
| Median | 8.9% | 6.2% |
| Interquartile 25% (IQ1) | 6.0% | 5.2% |
| Interquartile 75% (IQ3) | 15.4% | 7.0% |
| Interquartile Range (IQR) | 9.3% | 1.8% |
| Standard Deviation (Sample) | 28.4% | 3.1% |
| Standard Deviation (Population) | 28.0% | 3.0% |
Similar Demographics by Disability Age 5 to 17
Demographics Similar to Iroquois by Disability Age 5 to 17
In terms of disability age 5 to 17, the demographic groups most similar to Iroquois are Creek (6.9%, a difference of 0.24%), Choctaw (6.9%, a difference of 0.33%), Cherokee (6.9%, a difference of 0.59%), Chickasaw (6.8%, a difference of 0.68%), and Cape Verdean (7.0%, a difference of 1.1%).
| Demographics | Rating | Rank | Disability Age 5 to 17 |
| French Canadians | 0.0 /100 | #331 | Tragic 6.7% |
| Immigrants | Azores | 0.0 /100 | #332 | Tragic 6.7% |
| Blacks/African Americans | 0.0 /100 | #333 | Tragic 6.8% |
| Seminole | 0.0 /100 | #334 | Tragic 6.8% |
| Ottawa | 0.0 /100 | #335 | Tragic 6.8% |
| Chickasaw | 0.0 /100 | #336 | Tragic 6.8% |
| Creek | 0.0 /100 | #337 | Tragic 6.9% |
| Iroquois | 0.0 /100 | #338 | Tragic 6.9% |
| Choctaw | 0.0 /100 | #339 | Tragic 6.9% |
| Cherokee | 0.0 /100 | #340 | Tragic 6.9% |
| Cape Verdeans | 0.0 /100 | #341 | Tragic 7.0% |
| Chippewa | 0.0 /100 | #342 | Tragic 7.1% |
| Immigrants | Cabo Verde | 0.0 /100 | #343 | Tragic 7.1% |
| Cajuns | 0.0 /100 | #344 | Tragic 7.2% |
| Tsimshian | 0.0 /100 | #345 | Tragic 7.9% |
Demographics Similar to Immigrants from Jamaica by Disability Age 5 to 17
In terms of disability age 5 to 17, the demographic groups most similar to Immigrants from Jamaica are Immigrants from Liberia (6.1%, a difference of 0.14%), Portuguese (6.1%, a difference of 0.14%), Puget Sound Salish (6.1%, a difference of 0.22%), Scottish (6.1%, a difference of 0.39%), and German (6.1%, a difference of 0.64%).
| Demographics | Rating | Rank | Disability Age 5 to 17 |
| Finns | 0.2 /100 | #272 | Tragic 6.0% |
| Alaska Natives | 0.2 /100 | #273 | Tragic 6.0% |
| Cheyenne | 0.2 /100 | #274 | Tragic 6.0% |
| Dutch | 0.2 /100 | #275 | Tragic 6.0% |
| Japanese | 0.1 /100 | #276 | Tragic 6.1% |
| Puget Sound Salish | 0.1 /100 | #277 | Tragic 6.1% |
| Immigrants | Liberia | 0.1 /100 | #278 | Tragic 6.1% |
| Immigrants | Jamaica | 0.1 /100 | #279 | Tragic 6.1% |
| Portuguese | 0.1 /100 | #280 | Tragic 6.1% |
| Scottish | 0.0 /100 | #281 | Tragic 6.1% |
| Germans | 0.0 /100 | #282 | Tragic 6.1% |
| Ugandans | 0.0 /100 | #283 | Tragic 6.2% |
| Sub-Saharan Africans | 0.0 /100 | #284 | Tragic 6.2% |
| English | 0.0 /100 | #285 | Tragic 6.2% |
| Colville | 0.0 /100 | #286 | Tragic 6.2% |