Iroquois vs Immigrants from Morocco Disability Age 5 to 17
COMPARE
Iroquois
Immigrants from Morocco
Disability Age 5 to 17
Disability Age 5 to 17 Comparison
Iroquois
Immigrants from Morocco
6.9%
DISABILITY AGE 5 TO 17
0.0/ 100
METRIC RATING
338th/ 347
METRIC RANK
5.8%
DISABILITY AGE 5 TO 17
8.3/ 100
METRIC RATING
214th/ 347
METRIC RANK
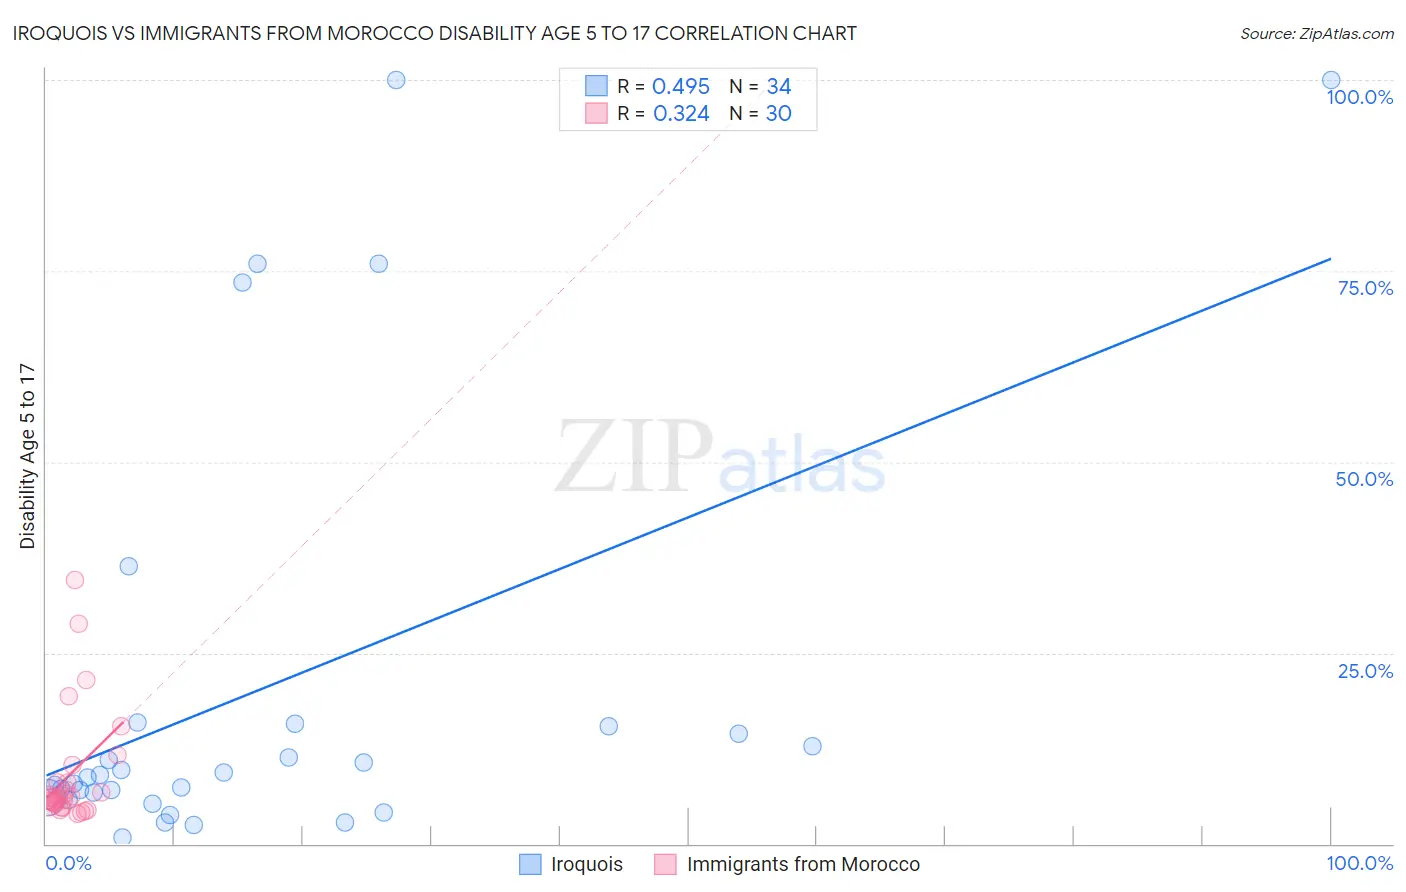
Iroquois vs Immigrants from Morocco Disability Age 5 to 17 Correlation Chart
The statistical analysis conducted on geographies consisting of 206,302,830 people shows a moderate positive correlation between the proportion of Iroquois and percentage of population with a disability between the ages 5 and 17 in the United States with a correlation coefficient (R) of 0.495 and weighted average of 6.9%. Similarly, the statistical analysis conducted on geographies consisting of 178,475,877 people shows a mild positive correlation between the proportion of Immigrants from Morocco and percentage of population with a disability between the ages 5 and 17 in the United States with a correlation coefficient (R) of 0.324 and weighted average of 5.8%, a difference of 19.4%.
Disability Age 5 to 17 Correlation Summary
| Measurement | Iroquois | Immigrants from Morocco |
| Minimum | 0.85% | 4.0% |
| Maximum | 100.0% | 34.6% |
| Range | 99.1% | 30.6% |
| Mean | 20.3% | 9.0% |
| Median | 8.9% | 6.0% |
| Interquartile 25% (IQ1) | 6.0% | 5.2% |
| Interquartile 75% (IQ3) | 15.4% | 8.0% |
| Interquartile Range (IQR) | 9.3% | 2.9% |
| Standard Deviation (Sample) | 28.4% | 7.5% |
| Standard Deviation (Population) | 28.0% | 7.4% |
Similar Demographics by Disability Age 5 to 17
Demographics Similar to Iroquois by Disability Age 5 to 17
In terms of disability age 5 to 17, the demographic groups most similar to Iroquois are Creek (6.9%, a difference of 0.24%), Choctaw (6.9%, a difference of 0.33%), Cherokee (6.9%, a difference of 0.59%), Chickasaw (6.8%, a difference of 0.68%), and Cape Verdean (7.0%, a difference of 1.1%).
| Demographics | Rating | Rank | Disability Age 5 to 17 |
| French Canadians | 0.0 /100 | #331 | Tragic 6.7% |
| Immigrants | Azores | 0.0 /100 | #332 | Tragic 6.7% |
| Blacks/African Americans | 0.0 /100 | #333 | Tragic 6.8% |
| Seminole | 0.0 /100 | #334 | Tragic 6.8% |
| Ottawa | 0.0 /100 | #335 | Tragic 6.8% |
| Chickasaw | 0.0 /100 | #336 | Tragic 6.8% |
| Creek | 0.0 /100 | #337 | Tragic 6.9% |
| Iroquois | 0.0 /100 | #338 | Tragic 6.9% |
| Choctaw | 0.0 /100 | #339 | Tragic 6.9% |
| Cherokee | 0.0 /100 | #340 | Tragic 6.9% |
| Cape Verdeans | 0.0 /100 | #341 | Tragic 7.0% |
| Chippewa | 0.0 /100 | #342 | Tragic 7.1% |
| Immigrants | Cabo Verde | 0.0 /100 | #343 | Tragic 7.1% |
| Cajuns | 0.0 /100 | #344 | Tragic 7.2% |
| Tsimshian | 0.0 /100 | #345 | Tragic 7.9% |
Demographics Similar to Immigrants from Morocco by Disability Age 5 to 17
In terms of disability age 5 to 17, the demographic groups most similar to Immigrants from Morocco are Immigrants from Cameroon (5.8%, a difference of 0.0%), Swedish (5.8%, a difference of 0.040%), Immigrants from Panama (5.8%, a difference of 0.050%), Yugoslavian (5.8%, a difference of 0.12%), and Nigerian (5.8%, a difference of 0.13%).
| Demographics | Rating | Rank | Disability Age 5 to 17 |
| Moroccans | 10.4 /100 | #207 | Poor 5.7% |
| Kenyans | 10.0 /100 | #208 | Poor 5.8% |
| Immigrants | Uganda | 9.7 /100 | #209 | Tragic 5.8% |
| Immigrants | Haiti | 9.5 /100 | #210 | Tragic 5.8% |
| Yugoslavians | 9.1 /100 | #211 | Tragic 5.8% |
| Immigrants | Panama | 8.7 /100 | #212 | Tragic 5.8% |
| Immigrants | Cameroon | 8.3 /100 | #213 | Tragic 5.8% |
| Immigrants | Morocco | 8.3 /100 | #214 | Tragic 5.8% |
| Swedes | 8.1 /100 | #215 | Tragic 5.8% |
| Nigerians | 7.5 /100 | #216 | Tragic 5.8% |
| Czechs | 7.4 /100 | #217 | Tragic 5.8% |
| Immigrants | Sierra Leone | 7.1 /100 | #218 | Tragic 5.8% |
| Sierra Leoneans | 7.0 /100 | #219 | Tragic 5.8% |
| Belgians | 6.9 /100 | #220 | Tragic 5.8% |
| Lithuanians | 6.7 /100 | #221 | Tragic 5.8% |