Immigrants from South Eastern Asia vs Northern European Disability Age 5 to 17
COMPARE
Immigrants from South Eastern Asia
Northern European
Disability Age 5 to 17
Disability Age 5 to 17 Comparison
Immigrants from South Eastern Asia
Northern Europeans
5.2%
DISABILITY AGE 5 TO 17
99.8/ 100
METRIC RATING
64th/ 347
METRIC RANK
5.7%
DISABILITY AGE 5 TO 17
15.2/ 100
METRIC RATING
199th/ 347
METRIC RANK
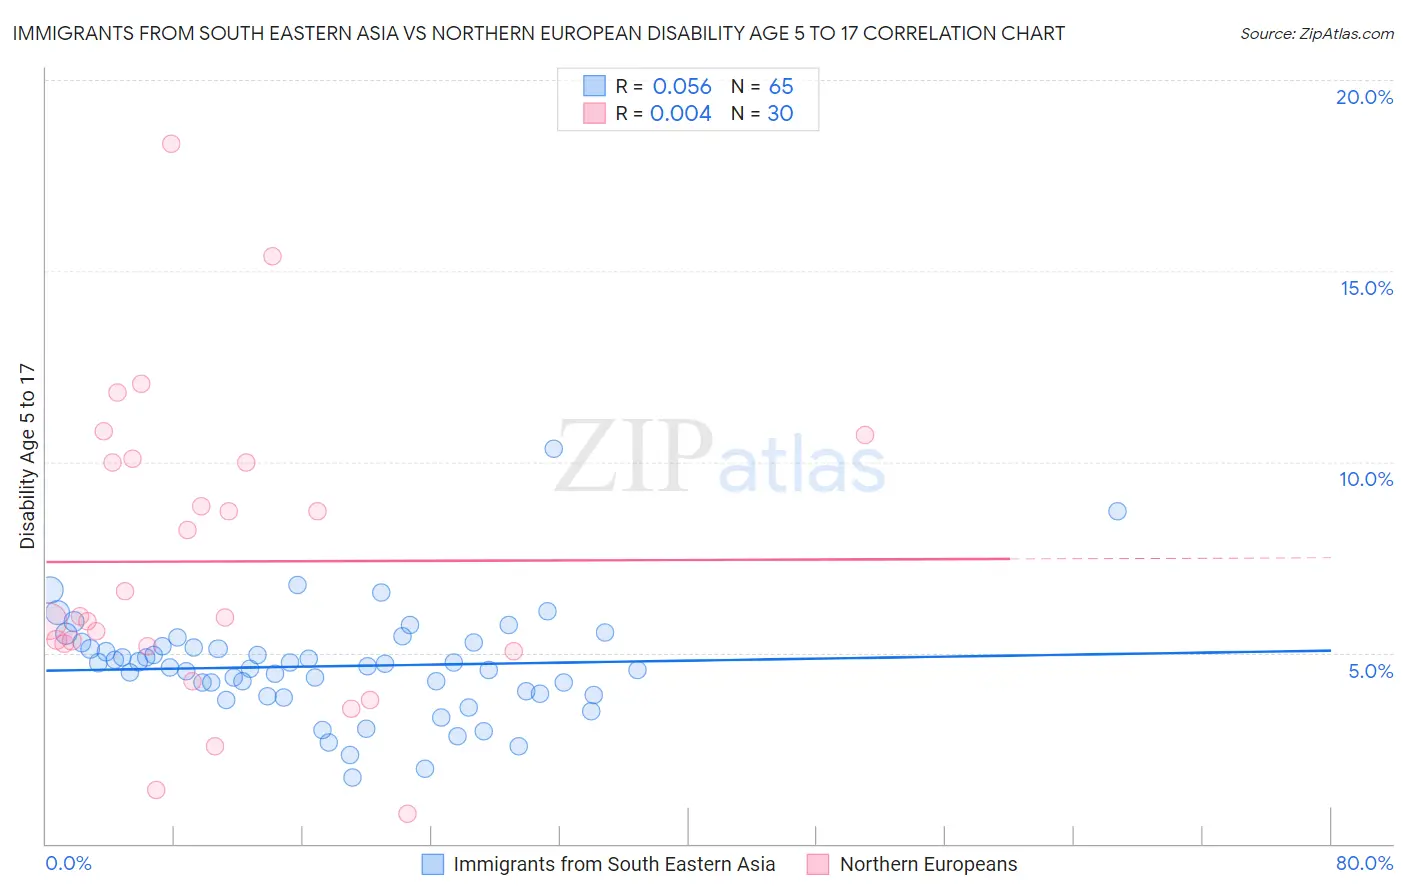
Immigrants from South Eastern Asia vs Northern European Disability Age 5 to 17 Correlation Chart
The statistical analysis conducted on geographies consisting of 505,803,855 people shows a slight positive correlation between the proportion of Immigrants from South Eastern Asia and percentage of population with a disability between the ages 5 and 17 in the United States with a correlation coefficient (R) of 0.056 and weighted average of 5.2%. Similarly, the statistical analysis conducted on geographies consisting of 401,696,711 people shows no correlation between the proportion of Northern Europeans and percentage of population with a disability between the ages 5 and 17 in the United States with a correlation coefficient (R) of 0.004 and weighted average of 5.7%, a difference of 10.5%.
Disability Age 5 to 17 Correlation Summary
| Measurement | Immigrants from South Eastern Asia | Northern European |
| Minimum | 1.7% | 0.78% |
| Maximum | 10.3% | 18.3% |
| Range | 8.6% | 17.5% |
| Mean | 4.6% | 7.4% |
| Median | 4.6% | 5.9% |
| Interquartile 25% (IQ1) | 3.9% | 5.2% |
| Interquartile 75% (IQ3) | 5.2% | 10.0% |
| Interquartile Range (IQR) | 1.3% | 4.8% |
| Standard Deviation (Sample) | 1.4% | 3.9% |
| Standard Deviation (Population) | 1.4% | 3.9% |
Similar Demographics by Disability Age 5 to 17
Demographics Similar to Immigrants from South Eastern Asia by Disability Age 5 to 17
In terms of disability age 5 to 17, the demographic groups most similar to Immigrants from South Eastern Asia are Immigrants from Greece (5.2%, a difference of 0.010%), Immigrants from Bangladesh (5.2%, a difference of 0.030%), Palestinian (5.2%, a difference of 0.060%), Macedonian (5.2%, a difference of 0.080%), and Immigrants from Ireland (5.2%, a difference of 0.14%).
| Demographics | Rating | Rank | Disability Age 5 to 17 |
| Immigrants | Poland | 99.9 /100 | #57 | Exceptional 5.1% |
| Immigrants | Ukraine | 99.9 /100 | #58 | Exceptional 5.1% |
| Immigrants | North Macedonia | 99.9 /100 | #59 | Exceptional 5.1% |
| Immigrants | Eastern Europe | 99.9 /100 | #60 | Exceptional 5.1% |
| Immigrants | Switzerland | 99.8 /100 | #61 | Exceptional 5.2% |
| Immigrants | Ireland | 99.8 /100 | #62 | Exceptional 5.2% |
| Immigrants | Bangladesh | 99.8 /100 | #63 | Exceptional 5.2% |
| Immigrants | South Eastern Asia | 99.8 /100 | #64 | Exceptional 5.2% |
| Immigrants | Greece | 99.8 /100 | #65 | Exceptional 5.2% |
| Palestinians | 99.8 /100 | #66 | Exceptional 5.2% |
| Macedonians | 99.8 /100 | #67 | Exceptional 5.2% |
| Immigrants | Syria | 99.7 /100 | #68 | Exceptional 5.2% |
| Guyanese | 99.7 /100 | #69 | Exceptional 5.2% |
| Immigrants | Belgium | 99.7 /100 | #70 | Exceptional 5.2% |
| Jordanians | 99.7 /100 | #71 | Exceptional 5.2% |
Demographics Similar to Northern Europeans by Disability Age 5 to 17
In terms of disability age 5 to 17, the demographic groups most similar to Northern Europeans are Icelander (5.7%, a difference of 0.060%), Basque (5.7%, a difference of 0.15%), Austrian (5.7%, a difference of 0.20%), Spanish American Indian (5.7%, a difference of 0.24%), and Paiute (5.7%, a difference of 0.42%).
| Demographics | Rating | Rank | Disability Age 5 to 17 |
| Immigrants | Bosnia and Herzegovina | 26.3 /100 | #192 | Fair 5.7% |
| Immigrants | Canada | 26.1 /100 | #193 | Fair 5.7% |
| Croatians | 23.6 /100 | #194 | Fair 5.7% |
| Immigrants | Nigeria | 23.4 /100 | #195 | Fair 5.7% |
| Inupiat | 23.3 /100 | #196 | Fair 5.7% |
| Immigrants | North America | 23.1 /100 | #197 | Fair 5.7% |
| Norwegians | 20.9 /100 | #198 | Fair 5.7% |
| Northern Europeans | 15.2 /100 | #199 | Poor 5.7% |
| Icelanders | 14.6 /100 | #200 | Poor 5.7% |
| Basques | 13.7 /100 | #201 | Poor 5.7% |
| Austrians | 13.2 /100 | #202 | Poor 5.7% |
| Spanish American Indians | 12.8 /100 | #203 | Poor 5.7% |
| Paiute | 11.2 /100 | #204 | Poor 5.7% |
| Trinidadians and Tobagonians | 10.8 /100 | #205 | Poor 5.7% |
| Immigrants | Africa | 10.8 /100 | #206 | Poor 5.7% |