Immigrants from Ireland vs Macedonian Self-Care Disability

COMPARE

Immigrants from Ireland
Race
Ancestry
AfghanAfricanAlaska NativeAlaskan AthabascanAlbanianAleutAlsatianAmericanApacheArabArapahoArgentineanArmenianAssyrian/Chaldean/SyriacAustralianAustrianBahamianBangladeshiBarbadianBasqueBelgianBelizeanBermudanBhutaneseBlackfeetBolivianBrazilianBritishBritish West IndianBulgarianBurmeseCajunCambodianCanadianCape VerdeanCarpatho RusynCelticCentral AmericanCentral American IndianCherokeeCheyenneChickasawChileanChineseChippewaChoctawColombianColvilleComancheCosta RicanCreeCreekCroatianCrowCubanCypriotCzechCzechoslovakianDanishDelawareDominicanDutchDutch West IndianEastern EuropeanEcuadorianEgyptianEnglishEstonianEthiopianEuropeanFijianFilipinoFinnishFrenchFrench American IndianFrench CanadianGermanGerman RussianGhanaianGreekGuamanian/ChamorroGuatemalanGuyaneseHaitianHmongHonduranHopiHoumaHungarianIcelanderIndian (Asian)IndonesianInupiatIranianIraqiIrishIroquoisIsraeliItalianJamaicanJapaneseJordanianKenyanKiowaKoreanLaotianLatvianLebaneseLiberianLithuanianLumbeeLuxembourgerMalaysianMalteseMarshalleseMenomineeMexicanMexican American IndianMongolianMoroccanNative HawaiianNavajoNepaleseNew ZealanderNicaraguanNigerianNorthern EuropeanNorwegianOkinawanOsageOttawaPaiutePakistaniPalestinianPanamanianParaguayanPennsylvania GermanPeruvianPimaPolishPortuguesePotawatomiPuebloPuerto RicanPuget Sound SalishRomanianRussianSalvadoranSamoanScandinavianScotch-IrishScottishSeminoleSenegaleseSerbianShoshoneSierra LeoneanSiouxSlavicSlovakSloveneSomaliSouth AfricanSouth AmericanSouth American IndianSoviet UnionSpaniardSpanishSpanish AmericanSpanish American IndianSri LankanSubsaharan AfricanSudaneseSwedishSwissSyrianTaiwaneseThaiTlingit-HaidaTohono O'OdhamTonganTrinidadian and TobagonianTsimshianTurkishU.S. Virgin IslanderUgandanUkrainianUruguayanUteVenezuelanVietnameseWelshWest IndianYakamaYaquiYugoslavianYumanYup'ikZimbabwean
Immigration
NonimmigrantsImmigrantsAfghanistanAfricaAlbaniaArgentinaArmeniaAsiaAustraliaAustriaBahamasBangladeshBarbadosBelarusBelgiumBelizeBoliviaBosnia and HerzegovinaBrazilBulgariaBurma/MyanmarCabo VerdeCambodiaCameroonCanadaCaribbeanCentral AmericaChileChinaColombiaCongoCosta RicaCroatiaCubaCzechoslovakiaDenmarkDominicaDominican RepublicEastern AfricaEastern AsiaEastern EuropeEcuadorEgyptEl SalvadorEnglandEritreaEthiopiaEuropeFijiFranceGermanyGhanaGreeceGrenadaGuatemalaGuyanaHaitiHondurasHong KongHungaryIndiaIndonesiaIranIraqIrelandIsraelItalyJamaicaJapanJordanKazakhstanKenyaKoreaKuwaitLaosLatin AmericaLatviaLebanonLiberiaLithuaniaMalaysiaMexicoMicronesiaMiddle AfricaMoldovaMoroccoNepalNetherlandsNicaraguaNigeriaNorth AmericaNorth MacedoniaNorthern AfricaNorthern EuropeNorwayOceaniaPakistanPanamaPeruPhilippinesPolandPortugalRomaniaRussiaSaudi ArabiaScotlandSenegalSerbiaSierra LeoneSingaporeSomaliaSouth AfricaSouth AmericaSouth Central AsiaSouth Eastern AsiaSouthern EuropeSpainSri LankaSt. Vincent and the GrenadinesSudanSwedenSwitzerlandSyriaTaiwanThailandTrinidad and TobagoTurkeyUgandaUkraineUruguayUzbekistanVenezuelaVietnamWest IndiesWestern AfricaWestern AsiaWestern EuropeYemenZaireZimbabweAzores
Macedonian
Race
Ancestry
AfghanAfricanAlaska NativeAlaskan AthabascanAlbanianAleutAlsatianAmericanApacheArabArapahoArgentineanArmenianAssyrian/Chaldean/SyriacAustralianAustrianBahamianBangladeshiBarbadianBasqueBelgianBelizeanBermudanBhutaneseBlackfeetBolivianBrazilianBritishBritish West IndianBulgarianBurmeseCajunCambodianCanadianCape VerdeanCarpatho RusynCelticCentral AmericanCentral American IndianCherokeeCheyenneChickasawChileanChineseChippewaChoctawColombianColvilleComancheCosta RicanCreeCreekCroatianCrowCubanCypriotCzechCzechoslovakianDanishDelawareDominicanDutchDutch West IndianEastern EuropeanEcuadorianEgyptianEnglishEstonianEthiopianEuropeanFijianFilipinoFinnishFrenchFrench American IndianFrench CanadianGermanGerman RussianGhanaianGreekGuamanian/ChamorroGuatemalanGuyaneseHaitianHmongHonduranHopiHoumaHungarianIcelanderIndian (Asian)IndonesianInupiatIranianIraqiIrishIroquoisIsraeliItalianJamaicanJapaneseJordanianKenyanKiowaKoreanLaotianLatvianLebaneseLiberianLithuanianLumbeeLuxembourgerMacedonianMalaysianMalteseMarshalleseMenomineeMexicanMexican American IndianMongolianMoroccanNative HawaiianNavajoNepaleseNew ZealanderNicaraguanNigerianNorthern EuropeanNorwegianOkinawanOsageOttawaPaiutePakistaniPalestinianPanamanianParaguayanPennsylvania GermanPeruvianPimaPolishPortuguesePotawatomiPuebloPuerto RicanPuget Sound SalishRomanianRussianSalvadoranSamoanScandinavianScotch-IrishScottishSeminoleSenegaleseSerbianShoshoneSierra LeoneanSiouxSlavicSlovakSloveneSomaliSouth AfricanSouth AmericanSouth American IndianSoviet UnionSpaniardSpanishSpanish AmericanSpanish American IndianSri LankanSubsaharan AfricanSudaneseSwedishSwissSyrianTaiwaneseThaiTlingit-HaidaTohono O'OdhamTonganTrinidadian and TobagonianTsimshianTurkishU.S. Virgin IslanderUgandanUkrainianUruguayanUteVenezuelanVietnameseWelshWest IndianYakamaYaquiYugoslavianYumanYup'ikZimbabwean
Immigration
NonimmigrantsImmigrantsAfghanistanAfricaAlbaniaArgentinaArmeniaAsiaAustraliaAustriaBahamasBangladeshBarbadosBelarusBelgiumBelizeBoliviaBosnia and HerzegovinaBrazilBulgariaBurma/MyanmarCabo VerdeCambodiaCameroonCanadaCaribbeanCentral AmericaChileChinaColombiaCongoCosta RicaCroatiaCubaCzechoslovakiaDenmarkDominicaDominican RepublicEastern AfricaEastern AsiaEastern EuropeEcuadorEgyptEl SalvadorEnglandEritreaEthiopiaEuropeFijiFranceGermanyGhanaGreeceGrenadaGuatemalaGuyanaHaitiHondurasHong KongHungaryIndiaIndonesiaIranIraqIsraelItalyJamaicaJapanJordanKazakhstanKenyaKoreaKuwaitLaosLatin AmericaLatviaLebanonLiberiaLithuaniaMalaysiaMexicoMicronesiaMiddle AfricaMoldovaMoroccoNepalNetherlandsNicaraguaNigeriaNorth AmericaNorth MacedoniaNorthern AfricaNorthern EuropeNorwayOceaniaPakistanPanamaPeruPhilippinesPolandPortugalRomaniaRussiaSaudi ArabiaScotlandSenegalSerbiaSierra LeoneSingaporeSomaliaSouth AfricaSouth AmericaSouth Central AsiaSouth Eastern AsiaSouthern EuropeSpainSri LankaSt. Vincent and the GrenadinesSudanSwedenSwitzerlandSyriaTaiwanThailandTrinidad and TobagoTurkeyUgandaUkraineUruguayUzbekistanVenezuelaVietnamWest IndiesWestern AfricaWestern AsiaWestern EuropeYemenZaireZimbabweAzores
Self-Care Disability
Income
Poverty
Unemployment
Labor Participation
Family Structure
Vehicle Availability
Education Level
Disability

Self-Care Disability Comparison

Immigrants from Ireland

Macedonians

Exceptional
Exceptional
2.3%
SELF-CARE DISABILITY
99.0/ 100
METRIC RATING
78th/ 347
METRIC RANK
2.4%
SELF-CARE DISABILITY
96.9/ 100
METRIC RATING
94th/ 347
METRIC RANK

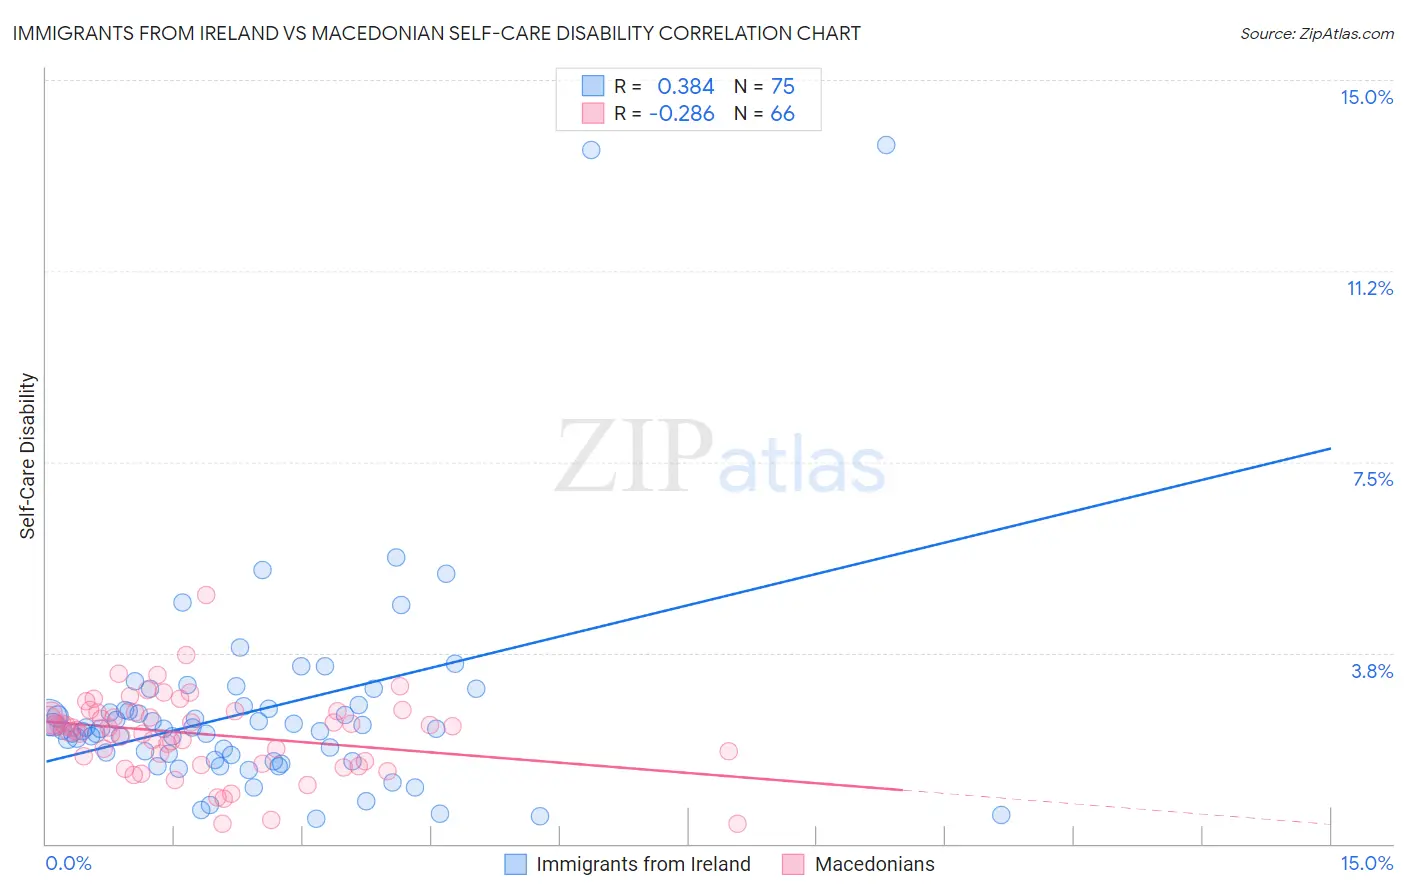
Immigrants from Ireland vs Macedonian Self-Care Disability Correlation Chart

The statistical analysis conducted on geographies consisting of 240,643,513 people shows a mild positive correlation between the proportion of Immigrants from Ireland and percentage of population with self-care disability in the United States with a correlation coefficient (R) of 0.384 and weighted average of 2.3%. Similarly, the statistical analysis conducted on geographies consisting of 132,583,440 people shows a weak negative correlation between the proportion of Macedonians and percentage of population with self-care disability in the United States with a correlation coefficient (R) of -0.286 and weighted average of 2.4%, a difference of 1.5%.
Immigrants from Ireland vs Macedonian Self-Care Disability

Self-Care Disability Correlation Summary

MeasurementImmigrants from IrelandMacedonian
Minimum0.50%0.40%
Maximum13.7%4.9%
Range13.2%4.5%
Mean2.6%2.2%
Median2.3%2.3%
Interquartile 25% (IQ1)1.7%1.6%
Interquartile 75% (IQ3)2.7%2.6%
Interquartile Range (IQR)1.0%0.97%
Standard Deviation (Sample)2.1%0.78%
Standard Deviation (Population)2.1%0.78%

Demographics Similar to Immigrants from Ireland and Macedonians by Self-Care Disability

In terms of self-care disability, the demographic groups most similar to Immigrants from Ireland are Immigrants from Middle Africa (2.3%, a difference of 0.0%), Immigrants from Kenya (2.3%, a difference of 0.010%), Immigrants from China (2.3%, a difference of 0.080%), Chilean (2.3%, a difference of 0.19%), and Ugandan (2.3%, a difference of 0.26%). Similarly, the demographic groups most similar to Macedonians are Immigrants from Asia (2.4%, a difference of 0.010%), Immigrants from Latvia (2.4%, a difference of 0.040%), Immigrants from Chile (2.4%, a difference of 0.070%), Icelander (2.4%, a difference of 0.24%), and Immigrants from Jordan (2.4%, a difference of 0.38%).
DemographicsRating | RankSelf-Care Disability
Immigrants | China
99.1
/100
|
#76
Exceptional
2.3%
Immigrants | Middle Africa
99.0
/100
|
#77
Exceptional
2.3%
Immigrants | Ireland
99.0
/100
|
#78
Exceptional
2.3%
Immigrants | Kenya
99.0
/100
|
#79
Exceptional
2.3%
Chileans
98.8
/100
|
#80
Exceptional
2.3%
Ugandans
98.8
/100
|
#81
Exceptional
2.3%
Immigrants | Denmark
98.8
/100
|
#82
Exceptional
2.3%
Indians (Asian)
98.7
/100
|
#83
Exceptional
2.3%
Immigrants | Spain
98.7
/100
|
#84
Exceptional
2.3%
Estonians
98.3
/100
|
#85
Exceptional
2.3%
Immigrants | Northern Africa
98.2
/100
|
#86
Exceptional
2.3%
Sierra Leoneans
98.0
/100
|
#87
Exceptional
2.4%
Lithuanians
98.0
/100
|
#88
Exceptional
2.4%
Immigrants | Congo
98.0
/100
|
#89
Exceptional
2.4%
Immigrants | Czechoslovakia
97.7
/100
|
#90
Exceptional
2.4%
Immigrants | Jordan
97.7
/100
|
#91
Exceptional
2.4%
Icelanders
97.4
/100
|
#92
Exceptional
2.4%
Immigrants | Latvia
97.0
/100
|
#93
Exceptional
2.4%
Macedonians
96.9
/100
|
#94
Exceptional
2.4%
Immigrants | Asia
96.9
/100
|
#95
Exceptional
2.4%
Immigrants | Chile
96.7
/100
|
#96
Exceptional
2.4%