French American Indian vs Moroccan Male Disability
COMPARE
French American Indian
Moroccan
Male Disability
Male Disability Comparison
French American Indians
Moroccans
13.4%
MALE DISABILITY
0.0/ 100
METRIC RATING
308th/ 347
METRIC RANK
11.0%
MALE DISABILITY
80.7/ 100
METRIC RATING
143rd/ 347
METRIC RANK
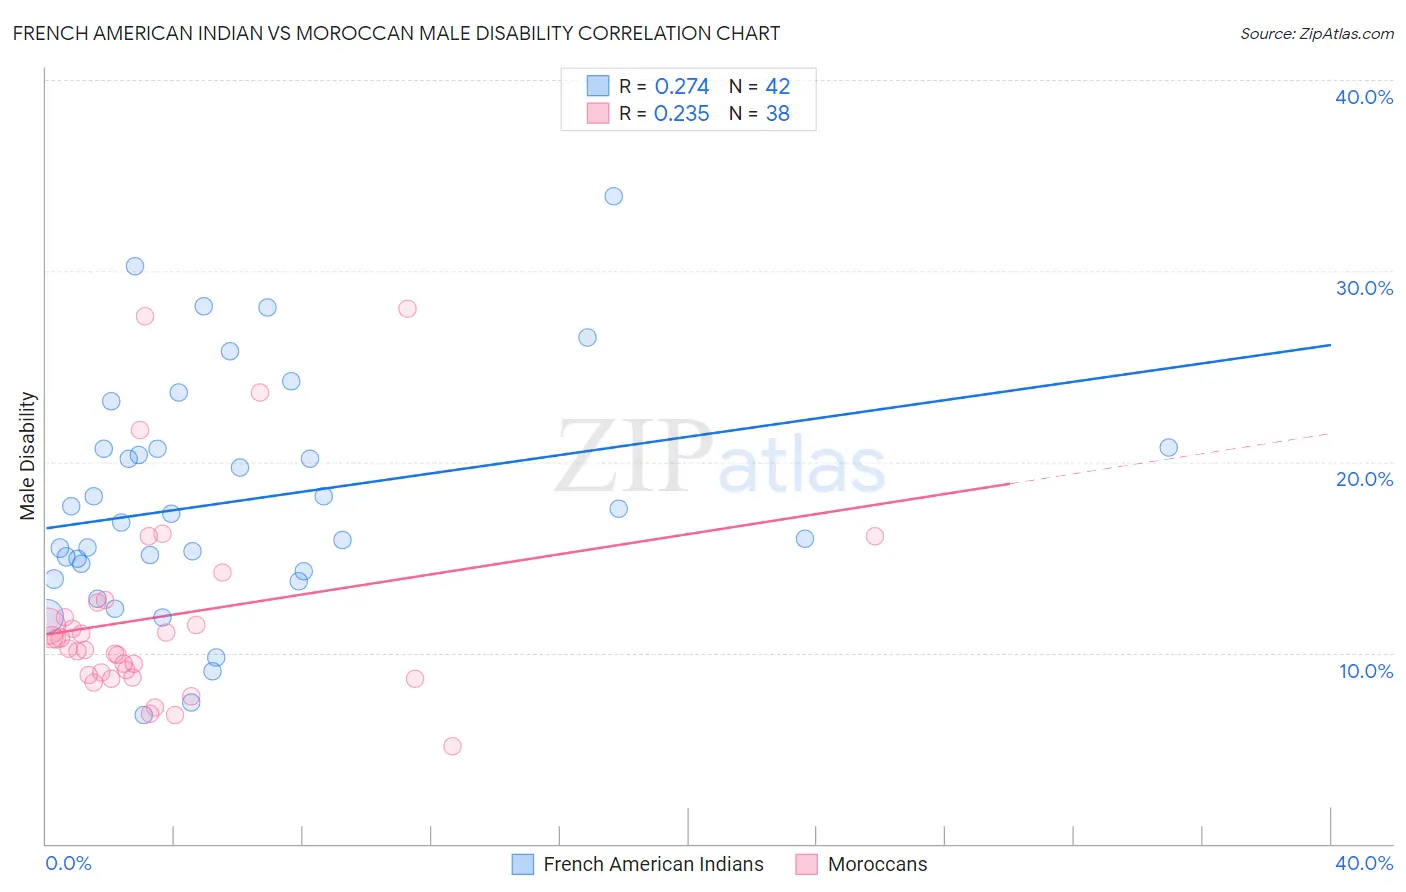
French American Indian vs Moroccan Male Disability Correlation Chart
The statistical analysis conducted on geographies consisting of 131,973,508 people shows a weak positive correlation between the proportion of French American Indians and percentage of males with a disability in the United States with a correlation coefficient (R) of 0.274 and weighted average of 13.4%. Similarly, the statistical analysis conducted on geographies consisting of 201,806,730 people shows a weak positive correlation between the proportion of Moroccans and percentage of males with a disability in the United States with a correlation coefficient (R) of 0.235 and weighted average of 11.0%, a difference of 21.5%.
Male Disability Correlation Summary
| Measurement | French American Indian | Moroccan |
| Minimum | 6.8% | 5.1% |
| Maximum | 33.9% | 28.0% |
| Range | 27.2% | 22.9% |
| Mean | 17.9% | 11.9% |
| Median | 17.0% | 10.5% |
| Interquartile 25% (IQ1) | 14.3% | 8.8% |
| Interquartile 75% (IQ3) | 20.7% | 12.6% |
| Interquartile Range (IQR) | 6.4% | 3.8% |
| Standard Deviation (Sample) | 6.1% | 5.3% |
| Standard Deviation (Population) | 6.0% | 5.2% |
Similar Demographics by Male Disability
Demographics Similar to French American Indians by Male Disability
In terms of male disability, the demographic groups most similar to French American Indians are Arapaho (13.3%, a difference of 0.15%), Spanish American (13.3%, a difference of 0.38%), Blackfeet (13.4%, a difference of 0.42%), Immigrants from the Azores (13.4%, a difference of 0.56%), and French Canadian (13.3%, a difference of 0.58%).
| Demographics | Rating | Rank | Male Disability |
| French | 0.0 /100 | #301 | Tragic 13.0% |
| Crow | 0.0 /100 | #302 | Tragic 13.1% |
| Scotch-Irish | 0.0 /100 | #303 | Tragic 13.2% |
| Blacks/African Americans | 0.0 /100 | #304 | Tragic 13.2% |
| French Canadians | 0.0 /100 | #305 | Tragic 13.3% |
| Spanish Americans | 0.0 /100 | #306 | Tragic 13.3% |
| Arapaho | 0.0 /100 | #307 | Tragic 13.3% |
| French American Indians | 0.0 /100 | #308 | Tragic 13.4% |
| Blackfeet | 0.0 /100 | #309 | Tragic 13.4% |
| Immigrants | Azores | 0.0 /100 | #310 | Tragic 13.4% |
| Delaware | 0.0 /100 | #311 | Tragic 13.5% |
| Yakama | 0.0 /100 | #312 | Tragic 13.5% |
| Puget Sound Salish | 0.0 /100 | #313 | Tragic 13.5% |
| Aleuts | 0.0 /100 | #314 | Tragic 13.5% |
| Iroquois | 0.0 /100 | #315 | Tragic 13.6% |
Demographics Similar to Moroccans by Male Disability
In terms of male disability, the demographic groups most similar to Moroccans are Immigrants from Italy (11.0%, a difference of 0.070%), Arab (11.0%, a difference of 0.070%), Immigrants from Sudan (11.0%, a difference of 0.070%), South African (11.0%, a difference of 0.090%), and Nigerian (11.0%, a difference of 0.11%).
| Demographics | Rating | Rank | Male Disability |
| Immigrants | Costa Rica | 82.8 /100 | #136 | Excellent 11.0% |
| Immigrants | Europe | 82.0 /100 | #137 | Excellent 11.0% |
| Nigerians | 81.9 /100 | #138 | Excellent 11.0% |
| South Africans | 81.7 /100 | #139 | Excellent 11.0% |
| Immigrants | Italy | 81.5 /100 | #140 | Excellent 11.0% |
| Arabs | 81.5 /100 | #141 | Excellent 11.0% |
| Immigrants | Sudan | 81.5 /100 | #142 | Excellent 11.0% |
| Moroccans | 80.7 /100 | #143 | Excellent 11.0% |
| Kenyans | 78.1 /100 | #144 | Good 11.0% |
| Costa Ricans | 78.0 /100 | #145 | Good 11.0% |
| Koreans | 77.5 /100 | #146 | Good 11.0% |
| Immigrants | Croatia | 77.3 /100 | #147 | Good 11.0% |
| Sudanese | 77.1 /100 | #148 | Good 11.0% |
| Immigrants | Denmark | 76.4 /100 | #149 | Good 11.0% |
| Immigrants | Guatemala | 75.1 /100 | #150 | Good 11.0% |