English vs Immigrants from Belgium Self-Care Disability
COMPARE
English
Immigrants from Belgium
Self-Care Disability
Self-Care Disability Comparison
English
Immigrants from Belgium
2.5%
SELF-CARE DISABILITY
46.2/ 100
METRIC RATING
178th/ 347
METRIC RANK
2.3%
SELF-CARE DISABILITY
99.6/ 100
METRIC RATING
57th/ 347
METRIC RANK
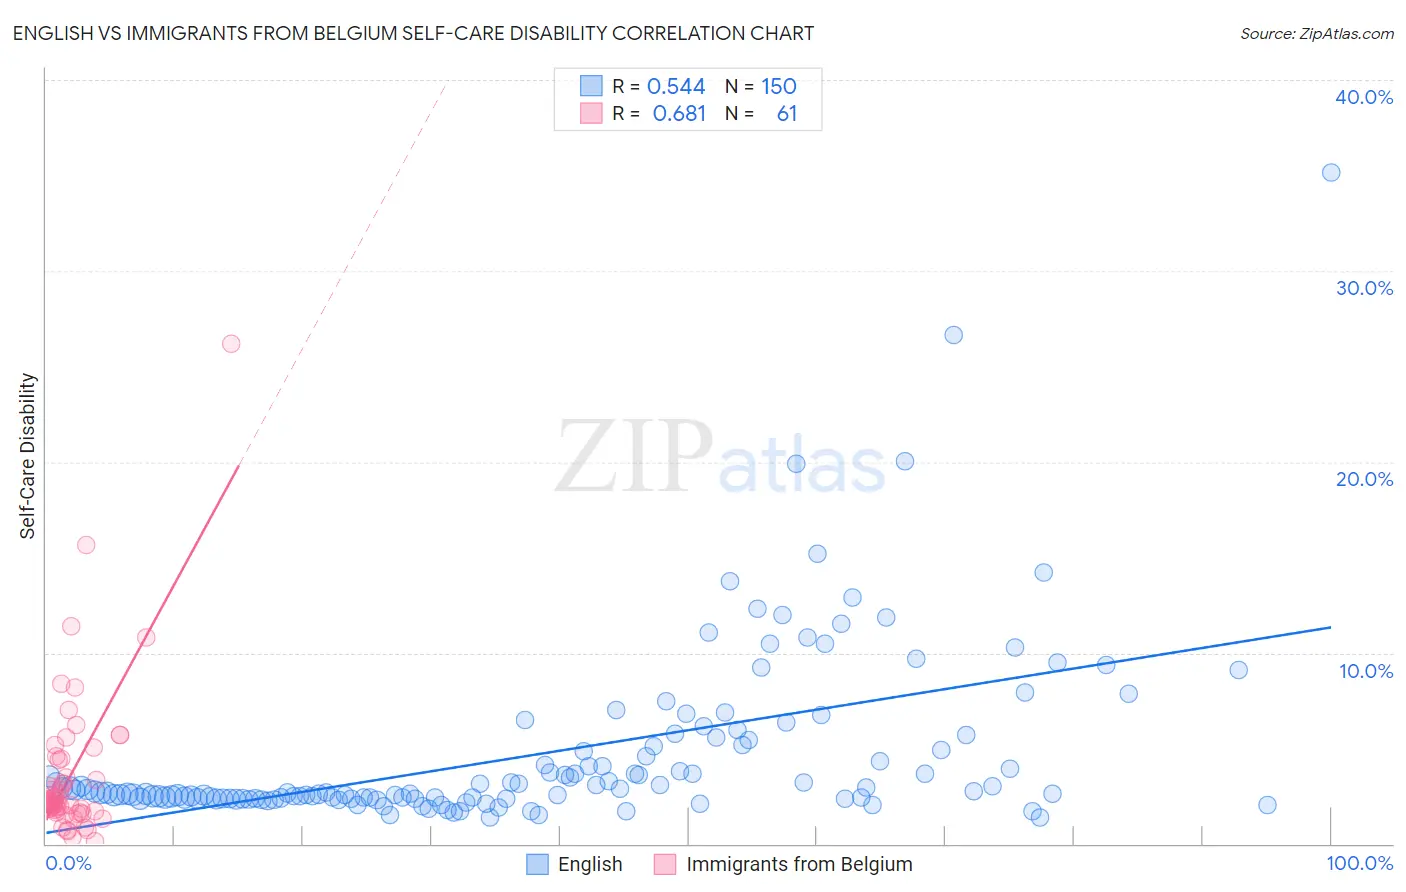
English vs Immigrants from Belgium Self-Care Disability Correlation Chart
The statistical analysis conducted on geographies consisting of 576,680,269 people shows a substantial positive correlation between the proportion of English and percentage of population with self-care disability in the United States with a correlation coefficient (R) of 0.544 and weighted average of 2.5%. Similarly, the statistical analysis conducted on geographies consisting of 146,636,859 people shows a significant positive correlation between the proportion of Immigrants from Belgium and percentage of population with self-care disability in the United States with a correlation coefficient (R) of 0.681 and weighted average of 2.3%, a difference of 7.2%.
Self-Care Disability Correlation Summary
| Measurement | English | Immigrants from Belgium |
| Minimum | 1.4% | 0.13% |
| Maximum | 35.1% | 26.2% |
| Range | 33.8% | 26.1% |
| Mean | 4.7% | 3.6% |
| Median | 2.7% | 2.2% |
| Interquartile 25% (IQ1) | 2.4% | 1.7% |
| Interquartile 75% (IQ3) | 5.2% | 4.4% |
| Interquartile Range (IQR) | 2.8% | 2.7% |
| Standard Deviation (Sample) | 4.7% | 4.1% |
| Standard Deviation (Population) | 4.7% | 4.1% |
Similar Demographics by Self-Care Disability
Demographics Similar to English by Self-Care Disability
In terms of self-care disability, the demographic groups most similar to English are Immigrants from Kazakhstan (2.5%, a difference of 0.020%), Hungarian (2.5%, a difference of 0.030%), Immigrants from Afghanistan (2.5%, a difference of 0.070%), Immigrants from Bosnia and Herzegovina (2.5%, a difference of 0.16%), and Welsh (2.5%, a difference of 0.18%).
| Demographics | Rating | Rank | Self-Care Disability |
| Pennsylvania Germans | 53.5 /100 | #171 | Average 2.5% |
| Czechoslovakians | 53.5 /100 | #172 | Average 2.5% |
| Immigrants | Burma/Myanmar | 52.8 /100 | #173 | Average 2.5% |
| Welsh | 50.0 /100 | #174 | Average 2.5% |
| Immigrants | Bosnia and Herzegovina | 49.6 /100 | #175 | Average 2.5% |
| Immigrants | Afghanistan | 47.6 /100 | #176 | Average 2.5% |
| Immigrants | Kazakhstan | 46.7 /100 | #177 | Average 2.5% |
| English | 46.2 /100 | #178 | Average 2.5% |
| Hungarians | 45.5 /100 | #179 | Average 2.5% |
| Indonesians | 41.2 /100 | #180 | Average 2.5% |
| Ghanaians | 40.4 /100 | #181 | Average 2.5% |
| Maltese | 37.5 /100 | #182 | Fair 2.5% |
| Salvadorans | 36.4 /100 | #183 | Fair 2.5% |
| Yugoslavians | 36.1 /100 | #184 | Fair 2.5% |
| Slavs | 34.3 /100 | #185 | Fair 2.5% |
Demographics Similar to Immigrants from Belgium by Self-Care Disability
In terms of self-care disability, the demographic groups most similar to Immigrants from Belgium are Immigrants from Eastern Asia (2.3%, a difference of 0.010%), Immigrants from France (2.3%, a difference of 0.040%), Immigrants from Cameroon (2.3%, a difference of 0.070%), Argentinean (2.3%, a difference of 0.11%), and Australian (2.3%, a difference of 0.15%).
| Demographics | Rating | Rank | Self-Care Disability |
| Immigrants | Brazil | 99.7 /100 | #50 | Exceptional 2.3% |
| Kenyans | 99.7 /100 | #51 | Exceptional 2.3% |
| Immigrants | Serbia | 99.6 /100 | #52 | Exceptional 2.3% |
| Australians | 99.6 /100 | #53 | Exceptional 2.3% |
| Argentineans | 99.6 /100 | #54 | Exceptional 2.3% |
| Immigrants | France | 99.6 /100 | #55 | Exceptional 2.3% |
| Immigrants | Eastern Asia | 99.6 /100 | #56 | Exceptional 2.3% |
| Immigrants | Belgium | 99.6 /100 | #57 | Exceptional 2.3% |
| Immigrants | Cameroon | 99.6 /100 | #58 | Exceptional 2.3% |
| New Zealanders | 99.5 /100 | #59 | Exceptional 2.3% |
| Immigrants | Japan | 99.5 /100 | #60 | Exceptional 2.3% |
| Palestinians | 99.4 /100 | #61 | Exceptional 2.3% |
| Egyptians | 99.4 /100 | #62 | Exceptional 2.3% |
| Mongolians | 99.3 /100 | #63 | Exceptional 2.3% |
| Swedes | 99.3 /100 | #64 | Exceptional 2.3% |