Cambodian vs Tohono O'odham Female Disability
COMPARE
Cambodian
Tohono O'odham
Female Disability
Female Disability Comparison
Cambodians
Tohono O'odham
11.3%
FEMALE DISABILITY
100.0/ 100
METRIC RATING
44th/ 347
METRIC RANK
15.0%
FEMALE DISABILITY
0.0/ 100
METRIC RATING
337th/ 347
METRIC RANK
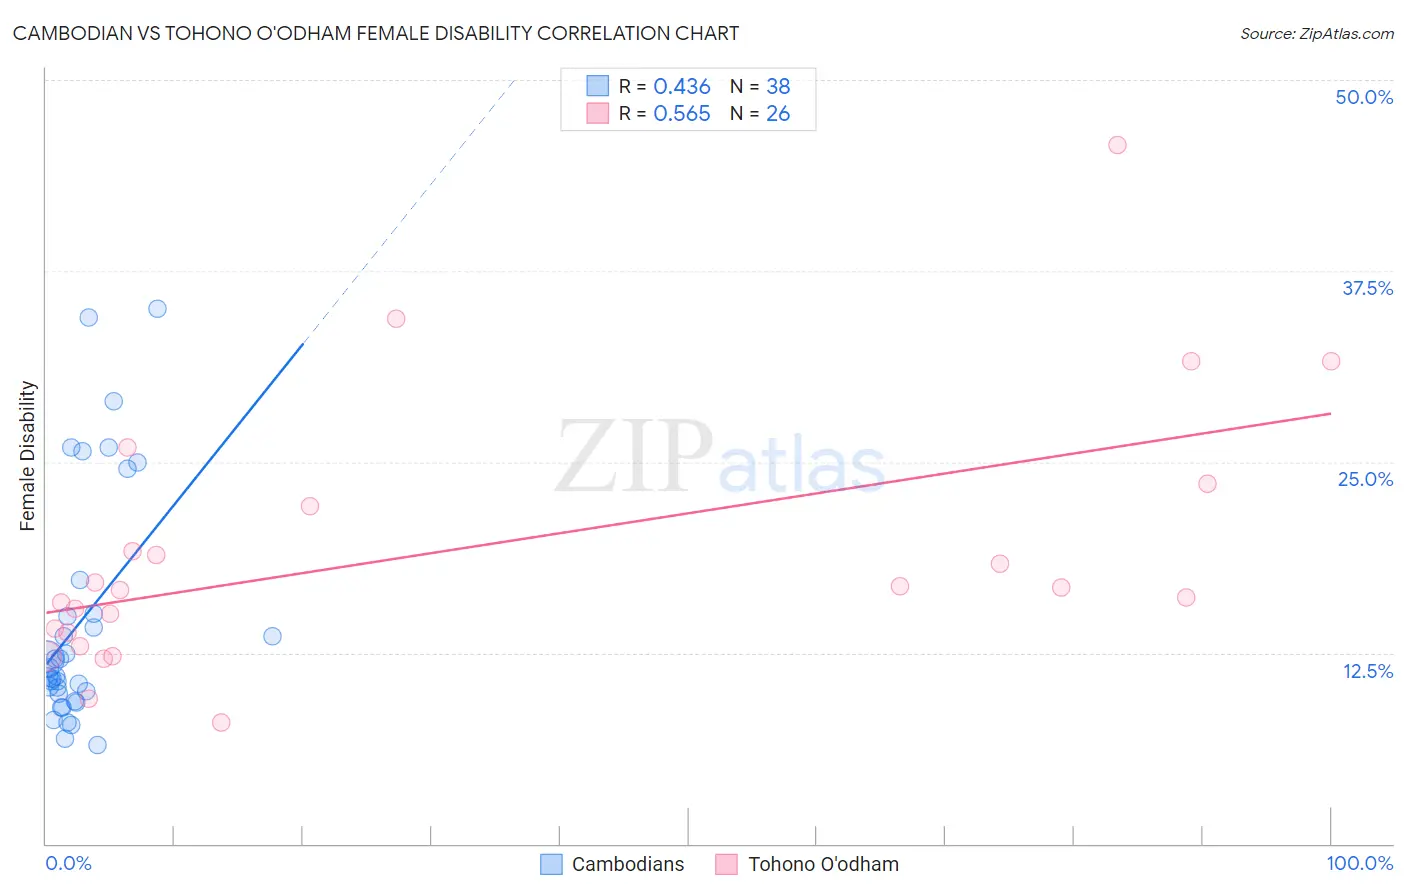
Cambodian vs Tohono O'odham Female Disability Correlation Chart
The statistical analysis conducted on geographies consisting of 102,507,228 people shows a moderate positive correlation between the proportion of Cambodians and percentage of females with a disability in the United States with a correlation coefficient (R) of 0.436 and weighted average of 11.3%. Similarly, the statistical analysis conducted on geographies consisting of 58,717,428 people shows a substantial positive correlation between the proportion of Tohono O'odham and percentage of females with a disability in the United States with a correlation coefficient (R) of 0.565 and weighted average of 15.0%, a difference of 33.1%.
Female Disability Correlation Summary
| Measurement | Cambodian | Tohono O'odham |
| Minimum | 6.5% | 8.0% |
| Maximum | 35.1% | 45.8% |
| Range | 28.6% | 37.8% |
| Mean | 14.5% | 19.1% |
| Median | 11.2% | 16.7% |
| Interquartile 25% (IQ1) | 9.9% | 13.9% |
| Interquartile 75% (IQ3) | 15.1% | 22.1% |
| Interquartile Range (IQR) | 5.2% | 8.3% |
| Standard Deviation (Sample) | 7.7% | 8.6% |
| Standard Deviation (Population) | 7.6% | 8.4% |
Similar Demographics by Female Disability
Demographics Similar to Cambodians by Female Disability
In terms of female disability, the demographic groups most similar to Cambodians are Immigrants from Sweden (11.3%, a difference of 0.040%), Immigrants from Nepal (11.3%, a difference of 0.080%), Jordanian (11.3%, a difference of 0.10%), Zimbabwean (11.3%, a difference of 0.11%), and Tongan (11.3%, a difference of 0.12%).
| Demographics | Rating | Rank | Female Disability |
| Ethiopians | 100.0 /100 | #37 | Exceptional 11.2% |
| Immigrants | Ethiopia | 100.0 /100 | #38 | Exceptional 11.2% |
| Immigrants | Lithuania | 100.0 /100 | #39 | Exceptional 11.2% |
| Mongolians | 100.0 /100 | #40 | Exceptional 11.2% |
| Paraguayans | 100.0 /100 | #41 | Exceptional 11.2% |
| Israelis | 100.0 /100 | #42 | Exceptional 11.2% |
| Afghans | 100.0 /100 | #43 | Exceptional 11.2% |
| Cambodians | 100.0 /100 | #44 | Exceptional 11.3% |
| Immigrants | Sweden | 100.0 /100 | #45 | Exceptional 11.3% |
| Immigrants | Nepal | 100.0 /100 | #46 | Exceptional 11.3% |
| Jordanians | 100.0 /100 | #47 | Exceptional 11.3% |
| Zimbabweans | 100.0 /100 | #48 | Exceptional 11.3% |
| Tongans | 100.0 /100 | #49 | Exceptional 11.3% |
| Inupiat | 100.0 /100 | #50 | Exceptional 11.3% |
| Immigrants | Belgium | 100.0 /100 | #51 | Exceptional 11.3% |
Demographics Similar to Tohono O'odham by Female Disability
In terms of female disability, the demographic groups most similar to Tohono O'odham are Seminole (15.0%, a difference of 0.12%), Dutch West Indian (15.0%, a difference of 0.14%), Colville (15.1%, a difference of 0.55%), Cajun (14.9%, a difference of 0.80%), and Cherokee (14.9%, a difference of 0.82%).
| Demographics | Rating | Rank | Female Disability |
| Yuman | 0.0 /100 | #330 | Tragic 14.5% |
| Immigrants | Cabo Verde | 0.0 /100 | #331 | Tragic 14.6% |
| Pima | 0.0 /100 | #332 | Tragic 14.8% |
| Immigrants | Azores | 0.0 /100 | #333 | Tragic 14.9% |
| Cherokee | 0.0 /100 | #334 | Tragic 14.9% |
| Cajuns | 0.0 /100 | #335 | Tragic 14.9% |
| Seminole | 0.0 /100 | #336 | Tragic 15.0% |
| Tohono O'odham | 0.0 /100 | #337 | Tragic 15.0% |
| Dutch West Indians | 0.0 /100 | #338 | Tragic 15.0% |
| Colville | 0.0 /100 | #339 | Tragic 15.1% |
| Chickasaw | 0.0 /100 | #340 | Tragic 15.2% |
| Choctaw | 0.0 /100 | #341 | Tragic 15.4% |
| Creek | 0.0 /100 | #342 | Tragic 15.7% |
| Lumbee | 0.0 /100 | #343 | Tragic 15.8% |
| Kiowa | 0.0 /100 | #344 | Tragic 15.8% |