Cambodian vs Immigrants from Iran Female Disability

COMPARE

Cambodian
Race
Ancestry
AfghanAfricanAlaska NativeAlaskan AthabascanAlbanianAleutAlsatianAmericanApacheArabArapahoArgentineanArmenianAssyrian/Chaldean/SyriacAustralianAustrianBahamianBangladeshiBarbadianBasqueBelgianBelizeanBermudanBhutaneseBlackfeetBolivianBrazilianBritishBritish West IndianBulgarianBurmeseCajunCambodianCanadianCape VerdeanCarpatho RusynCelticCentral AmericanCentral American IndianCherokeeCheyenneChickasawChileanChineseChippewaChoctawColombianColvilleComancheCosta RicanCreeCreekCroatianCrowCubanCypriotCzechCzechoslovakianDanishDelawareDominicanDutchDutch West IndianEastern EuropeanEcuadorianEgyptianEnglishEstonianEthiopianEuropeanFijianFilipinoFinnishFrenchFrench American IndianFrench CanadianGermanGerman RussianGhanaianGreekGuamanian/ChamorroGuatemalanGuyaneseHaitianHmongHonduranHopiHoumaHungarianIcelanderIndian (Asian)IndonesianInupiatIranianIraqiIrishIroquoisIsraeliItalianJamaicanJapaneseJordanianKenyanKiowaKoreanLaotianLatvianLebaneseLiberianLithuanianLumbeeLuxembourgerMacedonianMalaysianMalteseMarshalleseMenomineeMexicanMexican American IndianMongolianMoroccanNative HawaiianNavajoNepaleseNew ZealanderNicaraguanNigerianNorthern EuropeanNorwegianOkinawanOsageOttawaPaiutePakistaniPalestinianPanamanianParaguayanPennsylvania GermanPeruvianPimaPolishPortuguesePotawatomiPuebloPuerto RicanPuget Sound SalishRomanianRussianSalvadoranSamoanScandinavianScotch-IrishScottishSeminoleSenegaleseSerbianShoshoneSierra LeoneanSiouxSlavicSlovakSloveneSomaliSouth AfricanSouth AmericanSouth American IndianSoviet UnionSpaniardSpanishSpanish AmericanSpanish American IndianSri LankanSubsaharan AfricanSudaneseSwedishSwissSyrianTaiwaneseThaiTlingit-HaidaTohono O'OdhamTonganTrinidadian and TobagonianTsimshianTurkishU.S. Virgin IslanderUgandanUkrainianUruguayanUteVenezuelanVietnameseWelshWest IndianYakamaYaquiYugoslavianYumanYup'ikZimbabwean
Immigration
NonimmigrantsImmigrantsAfghanistanAfricaAlbaniaArgentinaArmeniaAsiaAustraliaAustriaBahamasBangladeshBarbadosBelarusBelgiumBelizeBoliviaBosnia and HerzegovinaBrazilBulgariaBurma/MyanmarCabo VerdeCambodiaCameroonCanadaCaribbeanCentral AmericaChileChinaColombiaCongoCosta RicaCroatiaCubaCzechoslovakiaDenmarkDominicaDominican RepublicEastern AfricaEastern AsiaEastern EuropeEcuadorEgyptEl SalvadorEnglandEritreaEthiopiaEuropeFijiFranceGermanyGhanaGreeceGrenadaGuatemalaGuyanaHaitiHondurasHong KongHungaryIndiaIndonesiaIraqIrelandIsraelItalyJamaicaJapanJordanKazakhstanKenyaKoreaKuwaitLaosLatin AmericaLatviaLebanonLiberiaLithuaniaMalaysiaMexicoMicronesiaMiddle AfricaMoldovaMoroccoNepalNetherlandsNicaraguaNigeriaNorth AmericaNorth MacedoniaNorthern AfricaNorthern EuropeNorwayOceaniaPakistanPanamaPeruPhilippinesPolandPortugalRomaniaRussiaSaudi ArabiaScotlandSenegalSerbiaSierra LeoneSingaporeSomaliaSouth AfricaSouth AmericaSouth Central AsiaSouth Eastern AsiaSouthern EuropeSpainSri LankaSt. Vincent and the GrenadinesSudanSwedenSwitzerlandSyriaTaiwanThailandTrinidad and TobagoTurkeyUgandaUkraineUruguayUzbekistanVenezuelaVietnamWest IndiesWestern AfricaWestern AsiaWestern EuropeYemenZaireZimbabweAzores
Immigrants from Iran
Race
Ancestry
AfghanAfricanAlaska NativeAlaskan AthabascanAlbanianAleutAlsatianAmericanApacheArabArapahoArgentineanArmenianAssyrian/Chaldean/SyriacAustralianAustrianBahamianBangladeshiBarbadianBasqueBelgianBelizeanBermudanBhutaneseBlackfeetBolivianBrazilianBritishBritish West IndianBulgarianBurmeseCajunCanadianCape VerdeanCarpatho RusynCelticCentral AmericanCentral American IndianCherokeeCheyenneChickasawChileanChineseChippewaChoctawColombianColvilleComancheCosta RicanCreeCreekCroatianCrowCubanCypriotCzechCzechoslovakianDanishDelawareDominicanDutchDutch West IndianEastern EuropeanEcuadorianEgyptianEnglishEstonianEthiopianEuropeanFijianFilipinoFinnishFrenchFrench American IndianFrench CanadianGermanGerman RussianGhanaianGreekGuamanian/ChamorroGuatemalanGuyaneseHaitianHmongHonduranHopiHoumaHungarianIcelanderIndian (Asian)IndonesianInupiatIranianIraqiIrishIroquoisIsraeliItalianJamaicanJapaneseJordanianKenyanKiowaKoreanLaotianLatvianLebaneseLiberianLithuanianLumbeeLuxembourgerMacedonianMalaysianMalteseMarshalleseMenomineeMexicanMexican American IndianMongolianMoroccanNative HawaiianNavajoNepaleseNew ZealanderNicaraguanNigerianNorthern EuropeanNorwegianOkinawanOsageOttawaPaiutePakistaniPalestinianPanamanianParaguayanPennsylvania GermanPeruvianPimaPolishPortuguesePotawatomiPuebloPuerto RicanPuget Sound SalishRomanianRussianSalvadoranSamoanScandinavianScotch-IrishScottishSeminoleSenegaleseSerbianShoshoneSierra LeoneanSiouxSlavicSlovakSloveneSomaliSouth AfricanSouth AmericanSouth American IndianSoviet UnionSpaniardSpanishSpanish AmericanSpanish American IndianSri LankanSubsaharan AfricanSudaneseSwedishSwissSyrianTaiwaneseThaiTlingit-HaidaTohono O'OdhamTonganTrinidadian and TobagonianTsimshianTurkishU.S. Virgin IslanderUgandanUkrainianUruguayanUteVenezuelanVietnameseWelshWest IndianYakamaYaquiYugoslavianYumanYup'ikZimbabwean
Immigration
NonimmigrantsImmigrantsAfghanistanAfricaAlbaniaArgentinaArmeniaAsiaAustraliaAustriaBahamasBangladeshBarbadosBelarusBelgiumBelizeBoliviaBosnia and HerzegovinaBrazilBulgariaBurma/MyanmarCabo VerdeCambodiaCameroonCanadaCaribbeanCentral AmericaChileChinaColombiaCongoCosta RicaCroatiaCubaCzechoslovakiaDenmarkDominicaDominican RepublicEastern AfricaEastern AsiaEastern EuropeEcuadorEgyptEl SalvadorEnglandEritreaEthiopiaEuropeFijiFranceGermanyGhanaGreeceGrenadaGuatemalaGuyanaHaitiHondurasHong KongHungaryIndiaIndonesiaIranIraqIrelandIsraelItalyJamaicaJapanJordanKazakhstanKenyaKoreaKuwaitLaosLatin AmericaLatviaLebanonLiberiaLithuaniaMalaysiaMexicoMicronesiaMiddle AfricaMoldovaMoroccoNepalNetherlandsNicaraguaNigeriaNorth AmericaNorth MacedoniaNorthern AfricaNorthern EuropeNorwayOceaniaPakistanPanamaPeruPhilippinesPolandPortugalRomaniaRussiaSaudi ArabiaScotlandSenegalSerbiaSierra LeoneSingaporeSomaliaSouth AfricaSouth AmericaSouth Central AsiaSouth Eastern AsiaSouthern EuropeSpainSri LankaSt. Vincent and the GrenadinesSudanSwedenSwitzerlandSyriaTaiwanThailandTrinidad and TobagoTurkeyUgandaUkraineUruguayUzbekistanVenezuelaVietnamWest IndiesWestern AfricaWestern AsiaWestern EuropeYemenZaireZimbabweAzores
Female Disability
Income
Poverty
Unemployment
Labor Participation
Family Structure
Vehicle Availability
Education Level
Disability

Female Disability Comparison

Cambodians

Immigrants from Iran

Exceptional
Exceptional
11.3%
FEMALE DISABILITY
100.0/ 100
METRIC RATING
44th/ 347
METRIC RANK
10.8%
FEMALE DISABILITY
100.0/ 100
METRIC RATING
18th/ 347
METRIC RANK

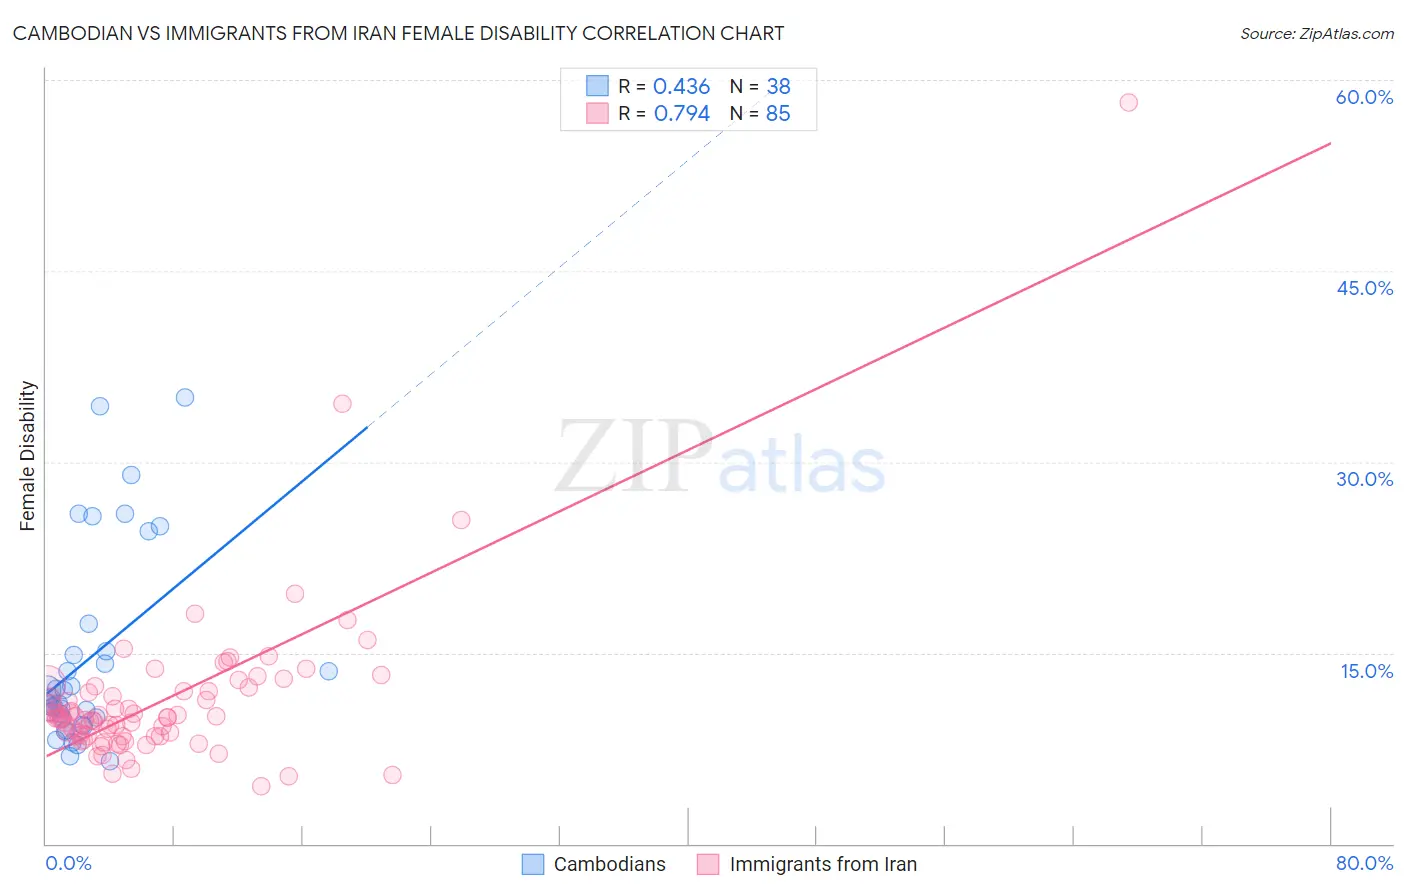
Cambodian vs Immigrants from Iran Female Disability Correlation Chart

The statistical analysis conducted on geographies consisting of 102,507,228 people shows a moderate positive correlation between the proportion of Cambodians and percentage of females with a disability in the United States with a correlation coefficient (R) of 0.436 and weighted average of 11.3%. Similarly, the statistical analysis conducted on geographies consisting of 279,884,220 people shows a strong positive correlation between the proportion of Immigrants from Iran and percentage of females with a disability in the United States with a correlation coefficient (R) of 0.794 and weighted average of 10.8%, a difference of 4.0%.
Cambodian vs Immigrants from Iran Female Disability

Female Disability Correlation Summary

MeasurementCambodianImmigrants from Iran
Minimum6.5%4.5%
Maximum35.1%58.2%
Range28.6%53.8%
Mean14.5%11.3%
Median11.2%9.9%
Interquartile 25% (IQ1)9.9%8.5%
Interquartile 75% (IQ3)15.1%12.1%
Interquartile Range (IQR)5.2%3.6%
Standard Deviation (Sample)7.7%6.6%
Standard Deviation (Population)7.6%6.6%

Similar Demographics by Female Disability

Demographics Similar to Cambodians by Female Disability

In terms of female disability, the demographic groups most similar to Cambodians are Immigrants from Sweden (11.3%, a difference of 0.040%), Immigrants from Nepal (11.3%, a difference of 0.080%), Jordanian (11.3%, a difference of 0.10%), Zimbabwean (11.3%, a difference of 0.11%), and Tongan (11.3%, a difference of 0.12%).
DemographicsRating | RankFemale Disability
Ethiopians
100.0
/100
|
#37
Exceptional
11.2%
Immigrants | Ethiopia
100.0
/100
|
#38
Exceptional
11.2%
Immigrants | Lithuania
100.0
/100
|
#39
Exceptional
11.2%
Mongolians
100.0
/100
|
#40
Exceptional
11.2%
Paraguayans
100.0
/100
|
#41
Exceptional
11.2%
Israelis
100.0
/100
|
#42
Exceptional
11.2%
Afghans
100.0
/100
|
#43
Exceptional
11.2%
Cambodians
100.0
/100
|
#44
Exceptional
11.3%
Immigrants | Sweden
100.0
/100
|
#45
Exceptional
11.3%
Immigrants | Nepal
100.0
/100
|
#46
Exceptional
11.3%
Jordanians
100.0
/100
|
#47
Exceptional
11.3%
Zimbabweans
100.0
/100
|
#48
Exceptional
11.3%
Tongans
100.0
/100
|
#49
Exceptional
11.3%
Inupiat
100.0
/100
|
#50
Exceptional
11.3%
Immigrants | Belgium
100.0
/100
|
#51
Exceptional
11.3%

Demographics Similar to Immigrants from Iran by Female Disability

In terms of female disability, the demographic groups most similar to Immigrants from Iran are Immigrants from Venezuela (10.9%, a difference of 0.21%), Indian (Asian) (10.8%, a difference of 0.38%), Immigrants from Pakistan (10.9%, a difference of 0.39%), Okinawan (10.8%, a difference of 0.70%), and Asian (10.9%, a difference of 0.75%).
DemographicsRating | RankFemale Disability
Immigrants | Korea
100.0
/100
|
#11
Exceptional
10.6%
Immigrants | Israel
100.0
/100
|
#12
Exceptional
10.7%
Immigrants | Eastern Asia
100.0
/100
|
#13
Exceptional
10.7%
Immigrants | China
100.0
/100
|
#14
Exceptional
10.7%
Burmese
100.0
/100
|
#15
Exceptional
10.7%
Okinawans
100.0
/100
|
#16
Exceptional
10.8%
Indians (Asian)
100.0
/100
|
#17
Exceptional
10.8%
Immigrants | Iran
100.0
/100
|
#18
Exceptional
10.8%
Immigrants | Venezuela
100.0
/100
|
#19
Exceptional
10.9%
Immigrants | Pakistan
100.0
/100
|
#20
Exceptional
10.9%
Asians
100.0
/100
|
#21
Exceptional
10.9%
Immigrants | Sri Lanka
100.0
/100
|
#22
Exceptional
10.9%
Venezuelans
100.0
/100
|
#23
Exceptional
11.0%
Immigrants | Argentina
100.0
/100
|
#24
Exceptional
11.0%
Immigrants | Asia
100.0
/100
|
#25
Exceptional
11.0%