Cambodian vs Immigrants from Zimbabwe Female Disability
COMPARE
Cambodian
Immigrants from Zimbabwe
Female Disability
Female Disability Comparison
Cambodians
Immigrants from Zimbabwe
11.3%
FEMALE DISABILITY
100.0/ 100
METRIC RATING
44th/ 347
METRIC RANK
11.6%
FEMALE DISABILITY
99.5/ 100
METRIC RATING
91st/ 347
METRIC RANK
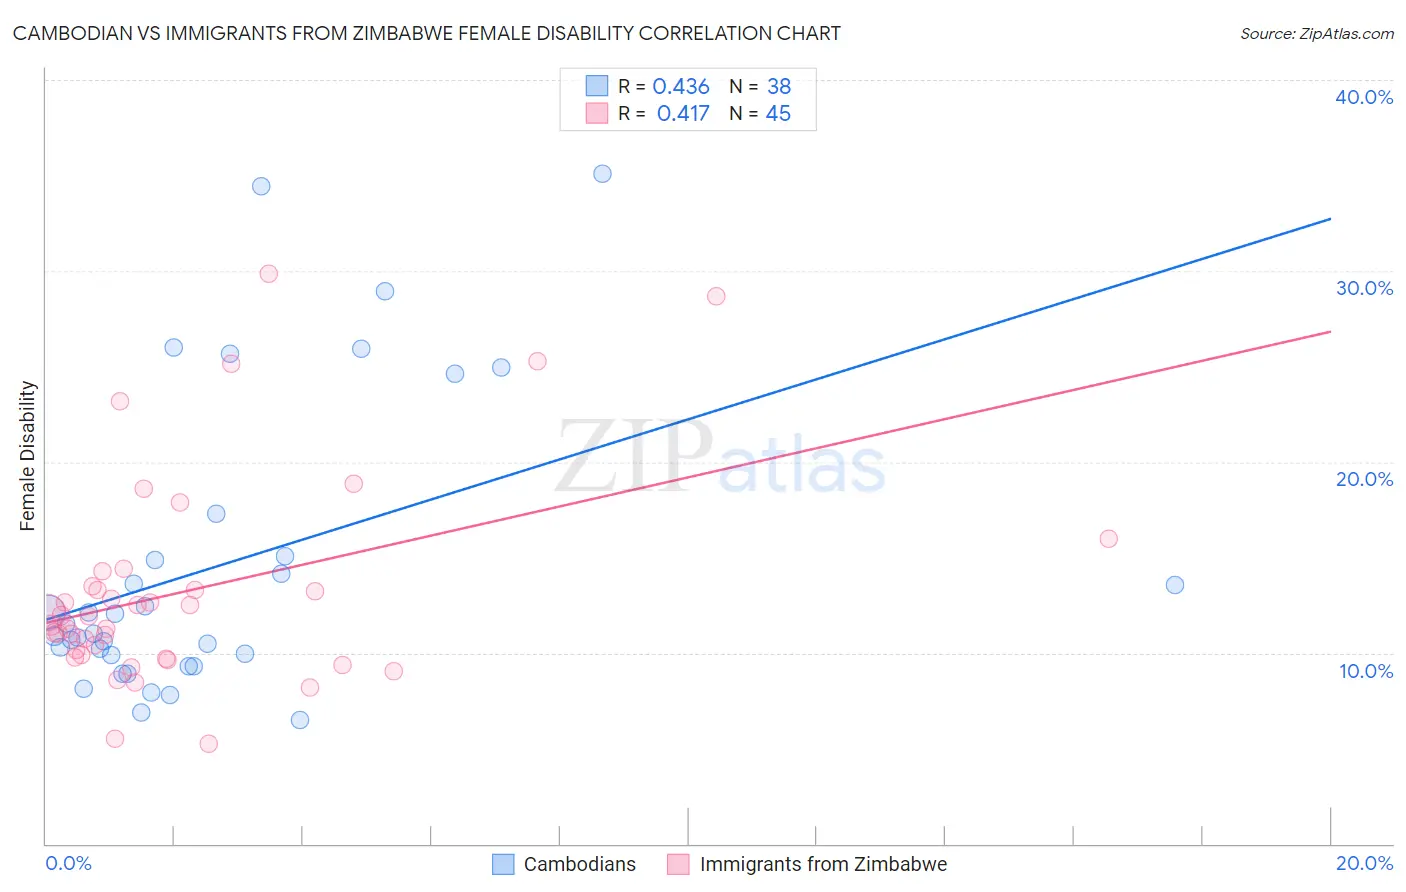
Cambodian vs Immigrants from Zimbabwe Female Disability Correlation Chart
The statistical analysis conducted on geographies consisting of 102,507,228 people shows a moderate positive correlation between the proportion of Cambodians and percentage of females with a disability in the United States with a correlation coefficient (R) of 0.436 and weighted average of 11.3%. Similarly, the statistical analysis conducted on geographies consisting of 117,810,271 people shows a moderate positive correlation between the proportion of Immigrants from Zimbabwe and percentage of females with a disability in the United States with a correlation coefficient (R) of 0.417 and weighted average of 11.6%, a difference of 2.9%.
Female Disability Correlation Summary
| Measurement | Cambodian | Immigrants from Zimbabwe |
| Minimum | 6.5% | 5.2% |
| Maximum | 35.1% | 29.8% |
| Range | 28.6% | 24.6% |
| Mean | 14.5% | 13.2% |
| Median | 11.2% | 11.9% |
| Interquartile 25% (IQ1) | 9.9% | 9.8% |
| Interquartile 75% (IQ3) | 15.1% | 13.9% |
| Interquartile Range (IQR) | 5.2% | 4.0% |
| Standard Deviation (Sample) | 7.7% | 5.5% |
| Standard Deviation (Population) | 7.6% | 5.5% |
Similar Demographics by Female Disability
Demographics Similar to Cambodians by Female Disability
In terms of female disability, the demographic groups most similar to Cambodians are Immigrants from Sweden (11.3%, a difference of 0.040%), Immigrants from Nepal (11.3%, a difference of 0.080%), Jordanian (11.3%, a difference of 0.10%), Zimbabwean (11.3%, a difference of 0.11%), and Tongan (11.3%, a difference of 0.12%).
| Demographics | Rating | Rank | Female Disability |
| Ethiopians | 100.0 /100 | #37 | Exceptional 11.2% |
| Immigrants | Ethiopia | 100.0 /100 | #38 | Exceptional 11.2% |
| Immigrants | Lithuania | 100.0 /100 | #39 | Exceptional 11.2% |
| Mongolians | 100.0 /100 | #40 | Exceptional 11.2% |
| Paraguayans | 100.0 /100 | #41 | Exceptional 11.2% |
| Israelis | 100.0 /100 | #42 | Exceptional 11.2% |
| Afghans | 100.0 /100 | #43 | Exceptional 11.2% |
| Cambodians | 100.0 /100 | #44 | Exceptional 11.3% |
| Immigrants | Sweden | 100.0 /100 | #45 | Exceptional 11.3% |
| Immigrants | Nepal | 100.0 /100 | #46 | Exceptional 11.3% |
| Jordanians | 100.0 /100 | #47 | Exceptional 11.3% |
| Zimbabweans | 100.0 /100 | #48 | Exceptional 11.3% |
| Tongans | 100.0 /100 | #49 | Exceptional 11.3% |
| Inupiat | 100.0 /100 | #50 | Exceptional 11.3% |
| Immigrants | Belgium | 100.0 /100 | #51 | Exceptional 11.3% |
Demographics Similar to Immigrants from Zimbabwe by Female Disability
In terms of female disability, the demographic groups most similar to Immigrants from Zimbabwe are Vietnamese (11.6%, a difference of 0.010%), Immigrants from Romania (11.6%, a difference of 0.010%), Immigrants from Czechoslovakia (11.6%, a difference of 0.010%), Immigrants from Denmark (11.6%, a difference of 0.11%), and Yup'ik (11.6%, a difference of 0.11%).
| Demographics | Rating | Rank | Female Disability |
| Immigrants | Poland | 99.6 /100 | #84 | Exceptional 11.6% |
| Palestinians | 99.6 /100 | #85 | Exceptional 11.6% |
| Immigrants | Cameroon | 99.6 /100 | #86 | Exceptional 11.6% |
| Immigrants | Denmark | 99.5 /100 | #87 | Exceptional 11.6% |
| Yup'ik | 99.5 /100 | #88 | Exceptional 11.6% |
| Vietnamese | 99.5 /100 | #89 | Exceptional 11.6% |
| Immigrants | Romania | 99.5 /100 | #90 | Exceptional 11.6% |
| Immigrants | Zimbabwe | 99.5 /100 | #91 | Exceptional 11.6% |
| Immigrants | Czechoslovakia | 99.5 /100 | #92 | Exceptional 11.6% |
| Immigrants | Sierra Leone | 99.4 /100 | #93 | Exceptional 11.6% |
| Immigrants | Brazil | 99.4 /100 | #94 | Exceptional 11.6% |
| Immigrants | Northern Europe | 99.4 /100 | #95 | Exceptional 11.6% |
| Immigrants | Russia | 99.0 /100 | #96 | Exceptional 11.7% |
| Koreans | 99.0 /100 | #97 | Exceptional 11.7% |
| Uruguayans | 98.8 /100 | #98 | Exceptional 11.7% |