Burmese vs Palestinian Self-Care Disability
COMPARE
Burmese
Palestinian
Self-Care Disability
Self-Care Disability Comparison
Burmese
Palestinians
2.3%
SELF-CARE DISABILITY
99.9/ 100
METRIC RATING
32nd/ 347
METRIC RANK
2.3%
SELF-CARE DISABILITY
99.4/ 100
METRIC RATING
61st/ 347
METRIC RANK
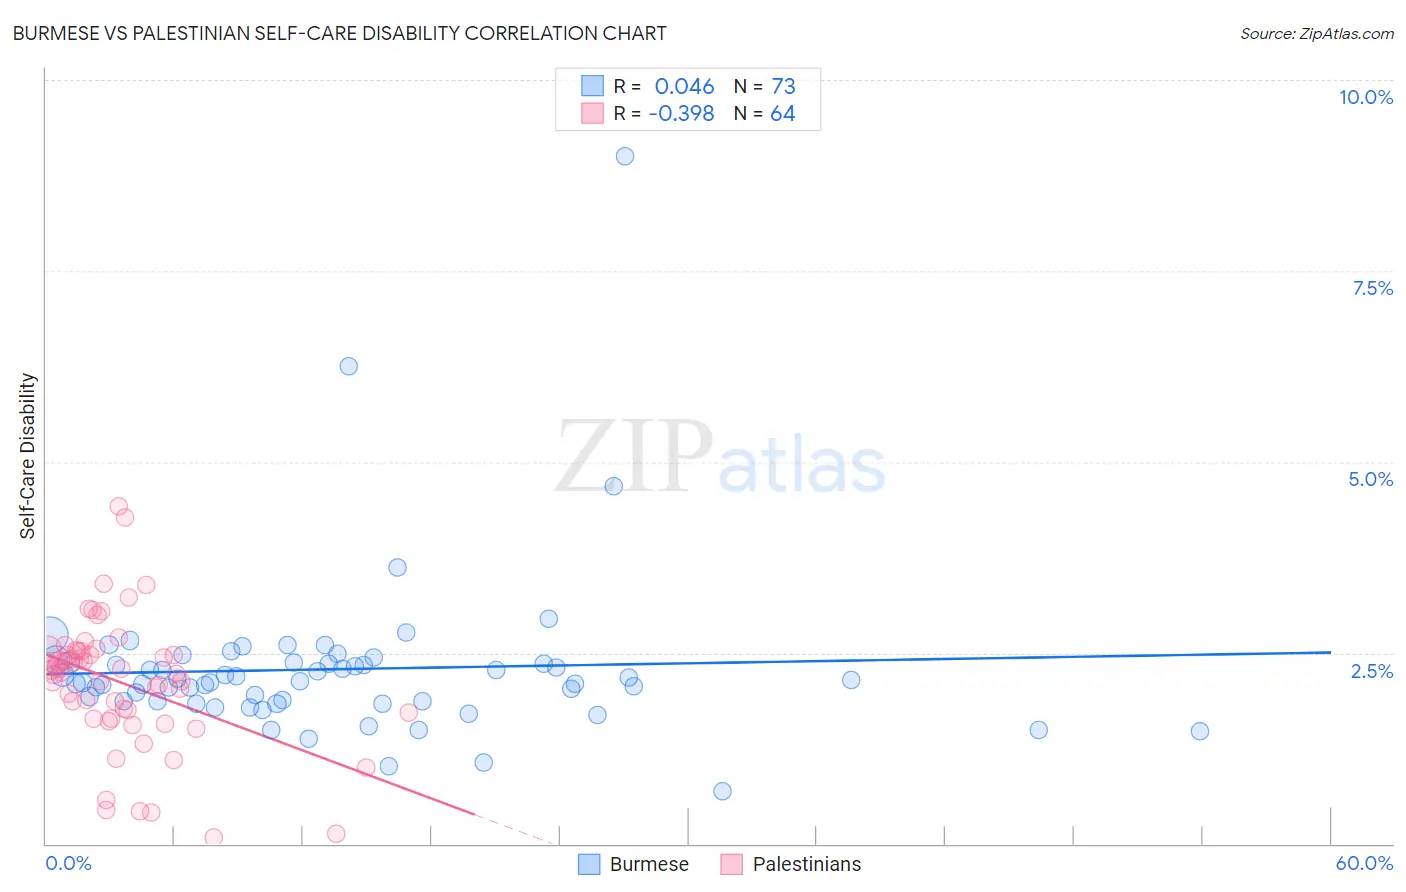
Burmese vs Palestinian Self-Care Disability Correlation Chart
The statistical analysis conducted on geographies consisting of 464,418,489 people shows no correlation between the proportion of Burmese and percentage of population with self-care disability in the United States with a correlation coefficient (R) of 0.046 and weighted average of 2.3%. Similarly, the statistical analysis conducted on geographies consisting of 216,359,093 people shows a mild negative correlation between the proportion of Palestinians and percentage of population with self-care disability in the United States with a correlation coefficient (R) of -0.398 and weighted average of 2.3%, a difference of 2.5%.
Self-Care Disability Correlation Summary
| Measurement | Burmese | Palestinian |
| Minimum | 0.68% | 0.076% |
| Maximum | 9.0% | 4.4% |
| Range | 8.3% | 4.3% |
| Mean | 2.3% | 2.1% |
| Median | 2.1% | 2.3% |
| Interquartile 25% (IQ1) | 1.9% | 1.7% |
| Interquartile 75% (IQ3) | 2.4% | 2.5% |
| Interquartile Range (IQR) | 0.51% | 0.83% |
| Standard Deviation (Sample) | 1.1% | 0.86% |
| Standard Deviation (Population) | 1.1% | 0.85% |
Similar Demographics by Self-Care Disability
Demographics Similar to Burmese by Self-Care Disability
In terms of self-care disability, the demographic groups most similar to Burmese are Danish (2.3%, a difference of 0.070%), Paraguayan (2.3%, a difference of 0.080%), Immigrants from Korea (2.3%, a difference of 0.23%), Immigrants from Turkey (2.3%, a difference of 0.29%), and Immigrants from Australia (2.3%, a difference of 0.35%).
| Demographics | Rating | Rank | Self-Care Disability |
| Turks | 100.0 /100 | #25 | Exceptional 2.2% |
| Immigrants | Sri Lanka | 99.9 /100 | #26 | Exceptional 2.2% |
| Venezuelans | 99.9 /100 | #27 | Exceptional 2.2% |
| Inupiat | 99.9 /100 | #28 | Exceptional 2.2% |
| Immigrants | Zimbabwe | 99.9 /100 | #29 | Exceptional 2.3% |
| Paraguayans | 99.9 /100 | #30 | Exceptional 2.3% |
| Danes | 99.9 /100 | #31 | Exceptional 2.3% |
| Burmese | 99.9 /100 | #32 | Exceptional 2.3% |
| Immigrants | Korea | 99.9 /100 | #33 | Exceptional 2.3% |
| Immigrants | Turkey | 99.9 /100 | #34 | Exceptional 2.3% |
| Immigrants | Australia | 99.9 /100 | #35 | Exceptional 2.3% |
| Immigrants | Lithuania | 99.9 /100 | #36 | Exceptional 2.3% |
| Immigrants | Sweden | 99.9 /100 | #37 | Exceptional 2.3% |
| Immigrants | Eastern Africa | 99.9 /100 | #38 | Exceptional 2.3% |
| Immigrants | Bulgaria | 99.8 /100 | #39 | Exceptional 2.3% |
Demographics Similar to Palestinians by Self-Care Disability
In terms of self-care disability, the demographic groups most similar to Palestinians are Egyptian (2.3%, a difference of 0.090%), Immigrants from Japan (2.3%, a difference of 0.10%), Mongolian (2.3%, a difference of 0.18%), Swedish (2.3%, a difference of 0.18%), and New Zealander (2.3%, a difference of 0.24%).
| Demographics | Rating | Rank | Self-Care Disability |
| Argentineans | 99.6 /100 | #54 | Exceptional 2.3% |
| Immigrants | France | 99.6 /100 | #55 | Exceptional 2.3% |
| Immigrants | Eastern Asia | 99.6 /100 | #56 | Exceptional 2.3% |
| Immigrants | Belgium | 99.6 /100 | #57 | Exceptional 2.3% |
| Immigrants | Cameroon | 99.6 /100 | #58 | Exceptional 2.3% |
| New Zealanders | 99.5 /100 | #59 | Exceptional 2.3% |
| Immigrants | Japan | 99.5 /100 | #60 | Exceptional 2.3% |
| Palestinians | 99.4 /100 | #61 | Exceptional 2.3% |
| Egyptians | 99.4 /100 | #62 | Exceptional 2.3% |
| Mongolians | 99.3 /100 | #63 | Exceptional 2.3% |
| Swedes | 99.3 /100 | #64 | Exceptional 2.3% |
| Brazilians | 99.3 /100 | #65 | Exceptional 2.3% |
| Immigrants | Argentina | 99.3 /100 | #66 | Exceptional 2.3% |
| South Africans | 99.3 /100 | #67 | Exceptional 2.3% |
| Immigrants | Zaire | 99.2 /100 | #68 | Exceptional 2.3% |