Burmese vs Immigrants from Burma/Myanmar Female Disability
COMPARE
Burmese
Immigrants from Burma/Myanmar
Female Disability
Female Disability Comparison
Burmese
Immigrants from Burma/Myanmar
10.7%
FEMALE DISABILITY
100.0/ 100
METRIC RATING
15th/ 347
METRIC RANK
12.4%
FEMALE DISABILITY
13.3/ 100
METRIC RATING
216th/ 347
METRIC RANK
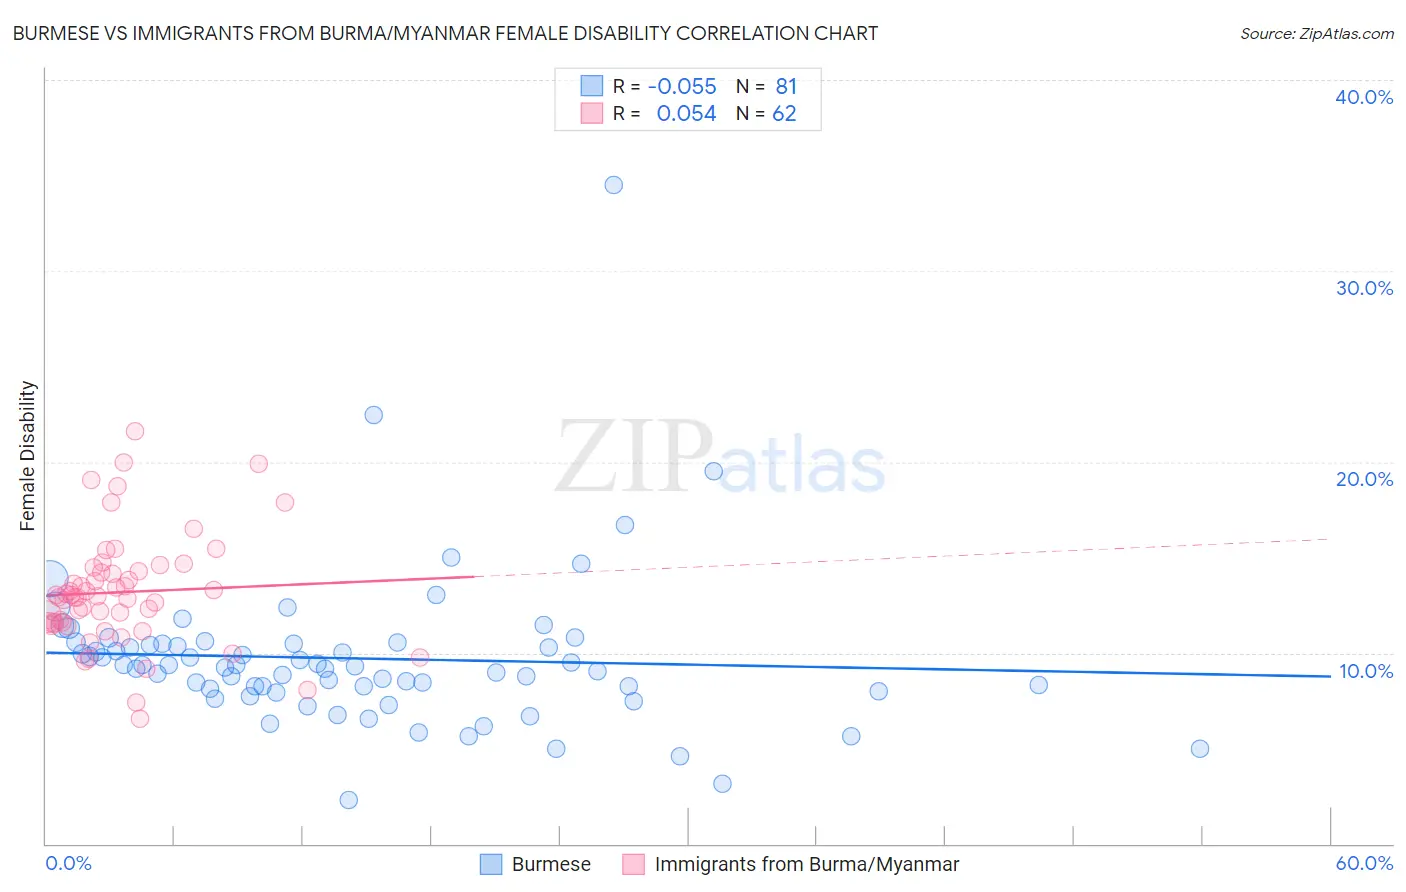
Burmese vs Immigrants from Burma/Myanmar Female Disability Correlation Chart
The statistical analysis conducted on geographies consisting of 465,299,673 people shows a slight negative correlation between the proportion of Burmese and percentage of females with a disability in the United States with a correlation coefficient (R) of -0.055 and weighted average of 10.7%. Similarly, the statistical analysis conducted on geographies consisting of 172,344,349 people shows a slight positive correlation between the proportion of Immigrants from Burma/Myanmar and percentage of females with a disability in the United States with a correlation coefficient (R) of 0.054 and weighted average of 12.4%, a difference of 15.5%.
Female Disability Correlation Summary
| Measurement | Burmese | Immigrants from Burma/Myanmar |
| Minimum | 2.3% | 6.6% |
| Maximum | 34.5% | 21.6% |
| Range | 32.2% | 15.0% |
| Mean | 9.7% | 13.2% |
| Median | 9.3% | 12.9% |
| Interquartile 25% (IQ1) | 8.1% | 11.6% |
| Interquartile 75% (IQ3) | 10.5% | 14.3% |
| Interquartile Range (IQR) | 2.4% | 2.7% |
| Standard Deviation (Sample) | 4.1% | 2.9% |
| Standard Deviation (Population) | 4.1% | 2.9% |
Similar Demographics by Female Disability
Demographics Similar to Burmese by Female Disability
In terms of female disability, the demographic groups most similar to Burmese are Okinawan (10.8%, a difference of 0.070%), Indian (Asian) (10.8%, a difference of 0.39%), Immigrants from China (10.7%, a difference of 0.51%), Immigrants from Eastern Asia (10.7%, a difference of 0.54%), and Immigrants from Israel (10.7%, a difference of 0.62%).
| Demographics | Rating | Rank | Female Disability |
| Immigrants | South Central Asia | 100.0 /100 | #8 | Exceptional 10.5% |
| Iranians | 100.0 /100 | #9 | Exceptional 10.6% |
| Immigrants | Hong Kong | 100.0 /100 | #10 | Exceptional 10.6% |
| Immigrants | Korea | 100.0 /100 | #11 | Exceptional 10.6% |
| Immigrants | Israel | 100.0 /100 | #12 | Exceptional 10.7% |
| Immigrants | Eastern Asia | 100.0 /100 | #13 | Exceptional 10.7% |
| Immigrants | China | 100.0 /100 | #14 | Exceptional 10.7% |
| Burmese | 100.0 /100 | #15 | Exceptional 10.7% |
| Okinawans | 100.0 /100 | #16 | Exceptional 10.8% |
| Indians (Asian) | 100.0 /100 | #17 | Exceptional 10.8% |
| Immigrants | Iran | 100.0 /100 | #18 | Exceptional 10.8% |
| Immigrants | Venezuela | 100.0 /100 | #19 | Exceptional 10.9% |
| Immigrants | Pakistan | 100.0 /100 | #20 | Exceptional 10.9% |
| Asians | 100.0 /100 | #21 | Exceptional 10.9% |
| Immigrants | Sri Lanka | 100.0 /100 | #22 | Exceptional 10.9% |
Demographics Similar to Immigrants from Burma/Myanmar by Female Disability
In terms of female disability, the demographic groups most similar to Immigrants from Burma/Myanmar are Panamanian (12.4%, a difference of 0.010%), Samoan (12.4%, a difference of 0.010%), British (12.4%, a difference of 0.050%), Immigrants from Bahamas (12.4%, a difference of 0.070%), and Immigrants from Thailand (12.4%, a difference of 0.090%).
| Demographics | Rating | Rank | Female Disability |
| Mexicans | 15.7 /100 | #209 | Poor 12.4% |
| Swiss | 14.9 /100 | #210 | Poor 12.4% |
| Immigrants | Bosnia and Herzegovina | 14.8 /100 | #211 | Poor 12.4% |
| Ute | 14.7 /100 | #212 | Poor 12.4% |
| Immigrants | Thailand | 14.5 /100 | #213 | Poor 12.4% |
| Panamanians | 13.5 /100 | #214 | Poor 12.4% |
| Samoans | 13.4 /100 | #215 | Poor 12.4% |
| Immigrants | Burma/Myanmar | 13.3 /100 | #216 | Poor 12.4% |
| British | 12.7 /100 | #217 | Poor 12.4% |
| Immigrants | Bahamas | 12.5 /100 | #218 | Poor 12.4% |
| Europeans | 12.1 /100 | #219 | Poor 12.4% |
| Bahamians | 11.1 /100 | #220 | Poor 12.4% |
| Native Hawaiians | 10.8 /100 | #221 | Poor 12.4% |
| Italians | 10.7 /100 | #222 | Poor 12.4% |
| Guamanians/Chamorros | 9.5 /100 | #223 | Tragic 12.5% |