Belizean vs Immigrants from Moldova Female Disability
COMPARE
Belizean
Immigrants from Moldova
Female Disability
Female Disability Comparison
Belizeans
Immigrants from Moldova
12.5%
FEMALE DISABILITY
9.3/ 100
METRIC RATING
224th/ 347
METRIC RANK
12.0%
FEMALE DISABILITY
81.4/ 100
METRIC RATING
150th/ 347
METRIC RANK
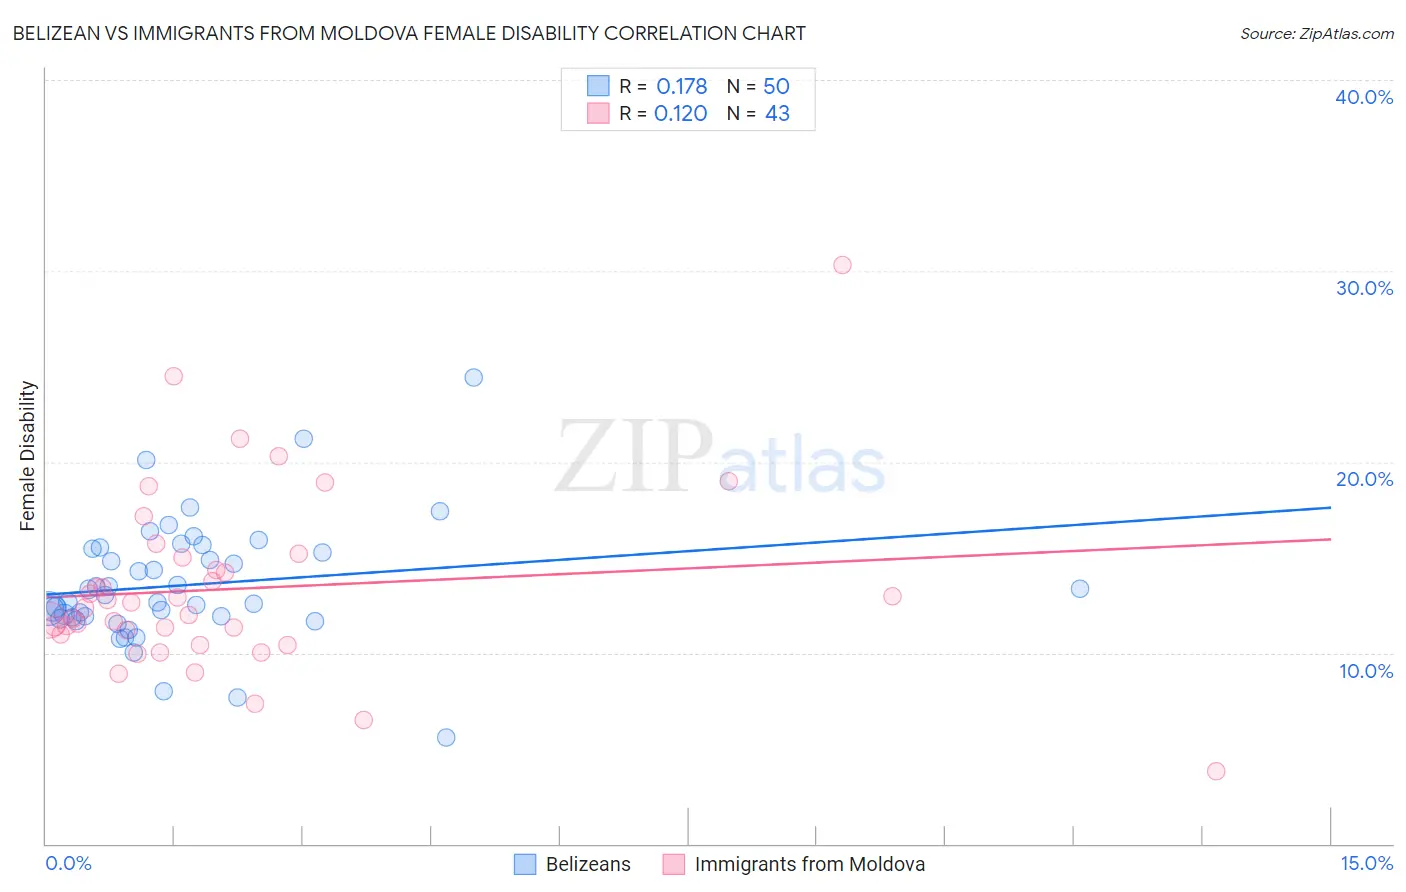
Belizean vs Immigrants from Moldova Female Disability Correlation Chart
The statistical analysis conducted on geographies consisting of 144,186,476 people shows a poor positive correlation between the proportion of Belizeans and percentage of females with a disability in the United States with a correlation coefficient (R) of 0.178 and weighted average of 12.5%. Similarly, the statistical analysis conducted on geographies consisting of 124,376,042 people shows a poor positive correlation between the proportion of Immigrants from Moldova and percentage of females with a disability in the United States with a correlation coefficient (R) of 0.120 and weighted average of 12.0%, a difference of 3.6%.
Female Disability Correlation Summary
| Measurement | Belizean | Immigrants from Moldova |
| Minimum | 5.5% | 3.8% |
| Maximum | 24.4% | 30.3% |
| Range | 18.9% | 26.5% |
| Mean | 13.5% | 13.4% |
| Median | 12.8% | 12.3% |
| Interquartile 25% (IQ1) | 11.8% | 11.0% |
| Interquartile 75% (IQ3) | 15.4% | 15.0% |
| Interquartile Range (IQR) | 3.6% | 4.0% |
| Standard Deviation (Sample) | 3.2% | 4.7% |
| Standard Deviation (Population) | 3.2% | 4.7% |
Similar Demographics by Female Disability
Demographics Similar to Belizeans by Female Disability
In terms of female disability, the demographic groups most similar to Belizeans are Guamanian/Chamorro (12.5%, a difference of 0.020%), Polish (12.5%, a difference of 0.10%), Italian (12.4%, a difference of 0.14%), Hispanic or Latino (12.5%, a difference of 0.15%), and Native Hawaiian (12.4%, a difference of 0.16%).
| Demographics | Rating | Rank | Female Disability |
| British | 12.7 /100 | #217 | Poor 12.4% |
| Immigrants | Bahamas | 12.5 /100 | #218 | Poor 12.4% |
| Europeans | 12.1 /100 | #219 | Poor 12.4% |
| Bahamians | 11.1 /100 | #220 | Poor 12.4% |
| Native Hawaiians | 10.8 /100 | #221 | Poor 12.4% |
| Italians | 10.7 /100 | #222 | Poor 12.4% |
| Guamanians/Chamorros | 9.5 /100 | #223 | Tragic 12.5% |
| Belizeans | 9.3 /100 | #224 | Tragic 12.5% |
| Poles | 8.4 /100 | #225 | Tragic 12.5% |
| Hispanics or Latinos | 8.0 /100 | #226 | Tragic 12.5% |
| Assyrians/Chaldeans/Syriacs | 8.0 /100 | #227 | Tragic 12.5% |
| Immigrants | Cambodia | 7.8 /100 | #228 | Tragic 12.5% |
| Hungarians | 7.2 /100 | #229 | Tragic 12.5% |
| Immigrants | Belize | 7.0 /100 | #230 | Tragic 12.5% |
| Belgians | 6.5 /100 | #231 | Tragic 12.5% |
Demographics Similar to Immigrants from Moldova by Female Disability
In terms of female disability, the demographic groups most similar to Immigrants from Moldova are Greek (12.0%, a difference of 0.030%), Icelander (12.0%, a difference of 0.040%), Immigrants from Kenya (12.0%, a difference of 0.11%), Immigrants from Scotland (12.0%, a difference of 0.13%), and Sudanese (12.0%, a difference of 0.14%).
| Demographics | Rating | Rank | Female Disability |
| Immigrants | Sudan | 89.6 /100 | #143 | Excellent 11.9% |
| Immigrants | Austria | 87.9 /100 | #144 | Excellent 12.0% |
| Estonians | 87.8 /100 | #145 | Excellent 12.0% |
| Pakistanis | 84.6 /100 | #146 | Excellent 12.0% |
| Nigerians | 84.0 /100 | #147 | Excellent 12.0% |
| Immigrants | Kenya | 83.1 /100 | #148 | Excellent 12.0% |
| Greeks | 82.0 /100 | #149 | Excellent 12.0% |
| Immigrants | Moldova | 81.4 /100 | #150 | Excellent 12.0% |
| Icelanders | 80.7 /100 | #151 | Excellent 12.0% |
| Immigrants | Scotland | 79.3 /100 | #152 | Good 12.0% |
| Sudanese | 79.1 /100 | #153 | Good 12.0% |
| Syrians | 76.9 /100 | #154 | Good 12.1% |
| Ghanaians | 76.6 /100 | #155 | Good 12.1% |
| Moroccans | 72.9 /100 | #156 | Good 12.1% |
| Danes | 72.5 /100 | #157 | Good 12.1% |