Zip Codes with the Highest Percentage of Population Employed in Architecture & Engineering in West Hartford, CT
RELATED REPORTS & OPTIONS
Architecture & Engineering
West Hartford
Compare Zip Codes
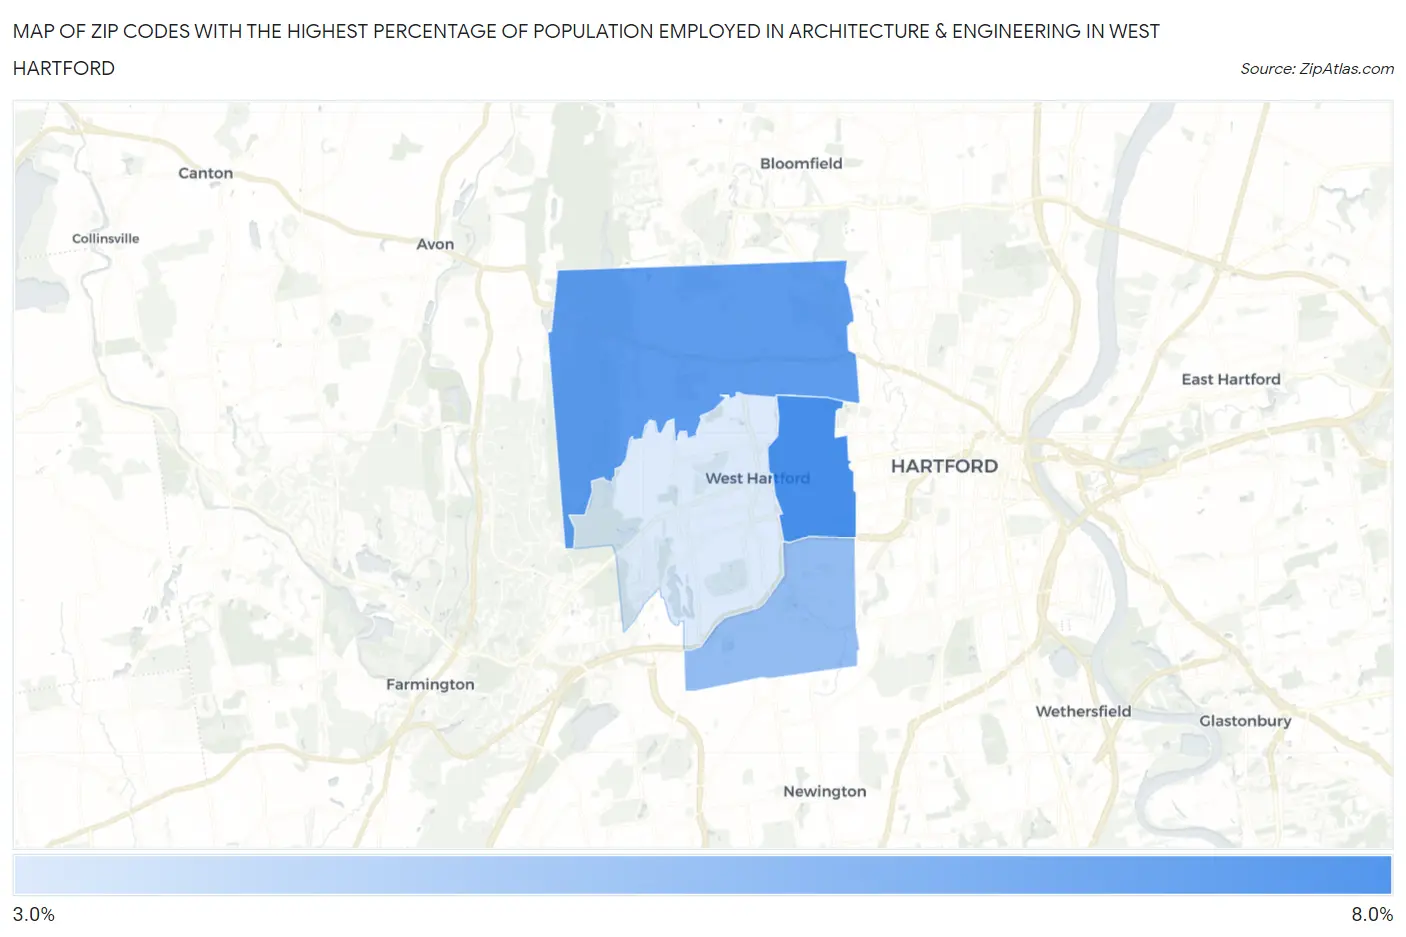
Map of Zip Codes with the Highest Percentage of Population Employed in Architecture & Engineering in West Hartford
3.6%
6.3%
Zip Codes with the Highest Percentage of Population Employed in Architecture & Engineering in West Hartford, CT
| Zip Code | % Employed | vs State | vs National | |
| 1. | 06119 | 6.3% | 2.6%(+3.71)#15 | 2.1%(+4.14)#963 |
| 2. | 06117 | 5.9% | 2.6%(+3.28)#21 | 2.1%(+3.71)#1,154 |
| 3. | 06110 | 4.9% | 2.6%(+2.34)#34 | 2.1%(+2.77)#1,716 |
| 4. | 06107 | 3.6% | 2.6%(+1.00)#69 | 2.1%(+1.43)#3,553 |
1
Common Questions
What are the Top 3 Zip Codes with the Highest Percentage of Population Employed in Architecture & Engineering in West Hartford, CT?
Top 3 Zip Codes with the Highest Percentage of Population Employed in Architecture & Engineering in West Hartford, CT are:
What zip code has the Highest Percentage of Population Employed in Architecture & Engineering in West Hartford, CT?
06119 has the Highest Percentage of Population Employed in Architecture & Engineering in West Hartford, CT with 6.3%.
What is the Percentage of Population Employed in Architecture & Engineering in West Hartford, CT?
Percentage of Population Employed in Architecture & Engineering in West Hartford is 5.0%.
What is the Percentage of Population Employed in Architecture & Engineering in Connecticut?
Percentage of Population Employed in Architecture & Engineering in Connecticut is 2.6%.
What is the Percentage of Population Employed in Architecture & Engineering in the United States?
Percentage of Population Employed in Architecture & Engineering in the United States is 2.1%.