Zip Codes with the Highest Percentage of Population Employed in Architecture & Engineering in Norwalk, CT
RELATED REPORTS & OPTIONS
Architecture & Engineering
Norwalk
Compare Zip Codes
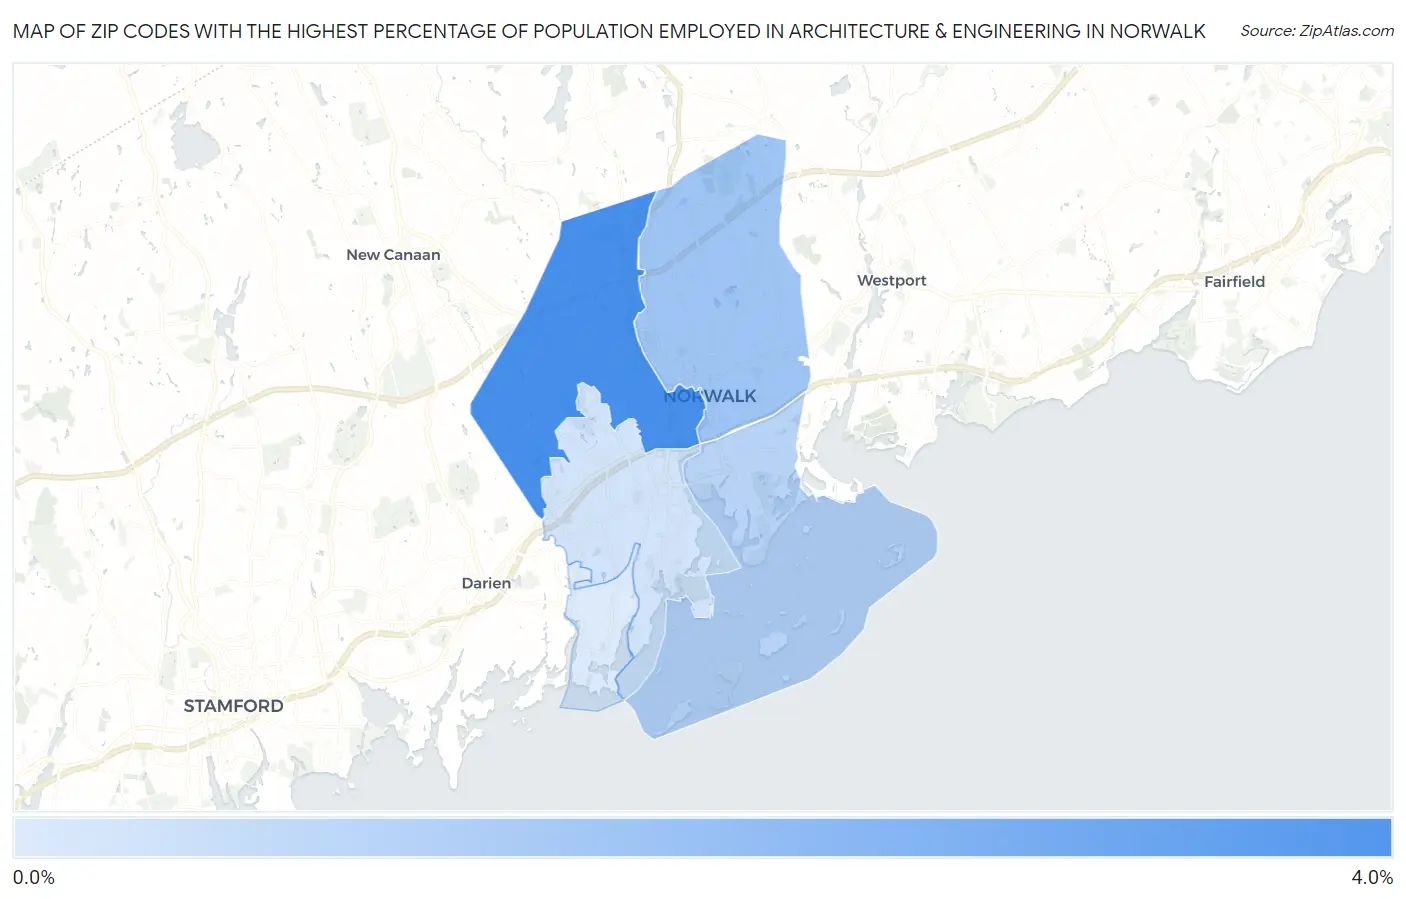
Map of Zip Codes with the Highest Percentage of Population Employed in Architecture & Engineering in Norwalk
0.34%
3.1%
Zip Codes with the Highest Percentage of Population Employed in Architecture & Engineering in Norwalk, CT
| Zip Code | % Employed | vs State | vs National | |
| 1. | 06850 | 3.1% | 2.6%(+0.504)#92 | 2.1%(+0.931)#4,787 |
| 2. | 06851 | 1.5% | 2.6%(-1.12)#178 | 2.1%(-0.696)#13,213 |
| 3. | 06855 | 1.00% | 2.6%(-1.58)#212 | 2.1%(-1.15)#16,611 |
| 4. | 06854 | 0.55% | 2.6%(-2.03)#226 | 2.1%(-1.60)#19,986 |
| 5. | 06853 | 0.34% | 2.6%(-2.24)#234 | 2.1%(-1.81)#21,362 |
1
Common Questions
What are the Top 3 Zip Codes with the Highest Percentage of Population Employed in Architecture & Engineering in Norwalk, CT?
Top 3 Zip Codes with the Highest Percentage of Population Employed in Architecture & Engineering in Norwalk, CT are:
What zip code has the Highest Percentage of Population Employed in Architecture & Engineering in Norwalk, CT?
06850 has the Highest Percentage of Population Employed in Architecture & Engineering in Norwalk, CT with 3.1%.
What is the Percentage of Population Employed in Architecture & Engineering in Norwalk, CT?
Percentage of Population Employed in Architecture & Engineering in Norwalk is 1.4%.
What is the Percentage of Population Employed in Architecture & Engineering in Connecticut?
Percentage of Population Employed in Architecture & Engineering in Connecticut is 2.6%.
What is the Percentage of Population Employed in Architecture & Engineering in the United States?
Percentage of Population Employed in Architecture & Engineering in the United States is 2.1%.