Zip Codes with the Highest Percentage of Population Employed in Architecture & Engineering in East Hartford, CT
RELATED REPORTS & OPTIONS
Architecture & Engineering
East Hartford
Compare Zip Codes
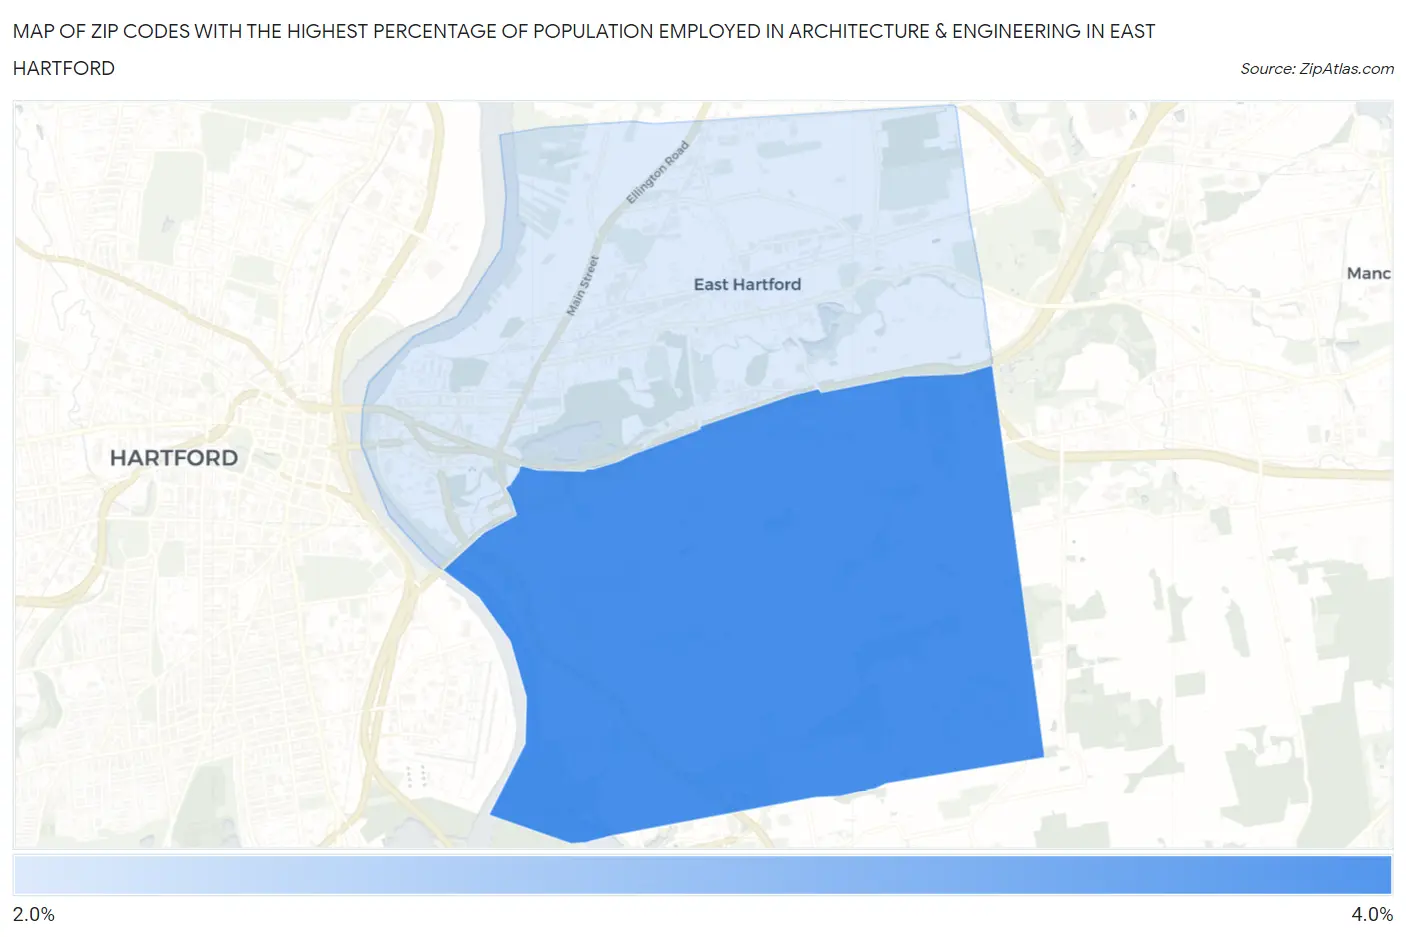
Map of Zip Codes with the Highest Percentage of Population Employed in Architecture & Engineering in East Hartford
2.4%
3.4%
Zip Codes with the Highest Percentage of Population Employed in Architecture & Engineering in East Hartford, CT
| Zip Code | % Employed | vs State | vs National | |
| 1. | 06118 | 3.4% | 2.6%(+0.868)#71 | 2.1%(+1.29)#3,872 |
| 2. | 06108 | 2.4% | 2.6%(-0.176)#123 | 2.1%(+0.251)#7,476 |
1
Common Questions
What are the Top Zip Codes with the Highest Percentage of Population Employed in Architecture & Engineering in East Hartford, CT?
Top Zip Codes with the Highest Percentage of Population Employed in Architecture & Engineering in East Hartford, CT are:
What zip code has the Highest Percentage of Population Employed in Architecture & Engineering in East Hartford, CT?
06118 has the Highest Percentage of Population Employed in Architecture & Engineering in East Hartford, CT with 3.4%.
What is the Percentage of Population Employed in Architecture & Engineering in East Hartford, CT?
Percentage of Population Employed in Architecture & Engineering in East Hartford is 3.0%.
What is the Percentage of Population Employed in Architecture & Engineering in Connecticut?
Percentage of Population Employed in Architecture & Engineering in Connecticut is 2.6%.
What is the Percentage of Population Employed in Architecture & Engineering in the United States?
Percentage of Population Employed in Architecture & Engineering in the United States is 2.1%.