Zip Codes with the Highest Percentage of Population Employed in Architecture & Engineering in Hamden, CT
RELATED REPORTS & OPTIONS
Architecture & Engineering
Hamden
Compare Zip Codes
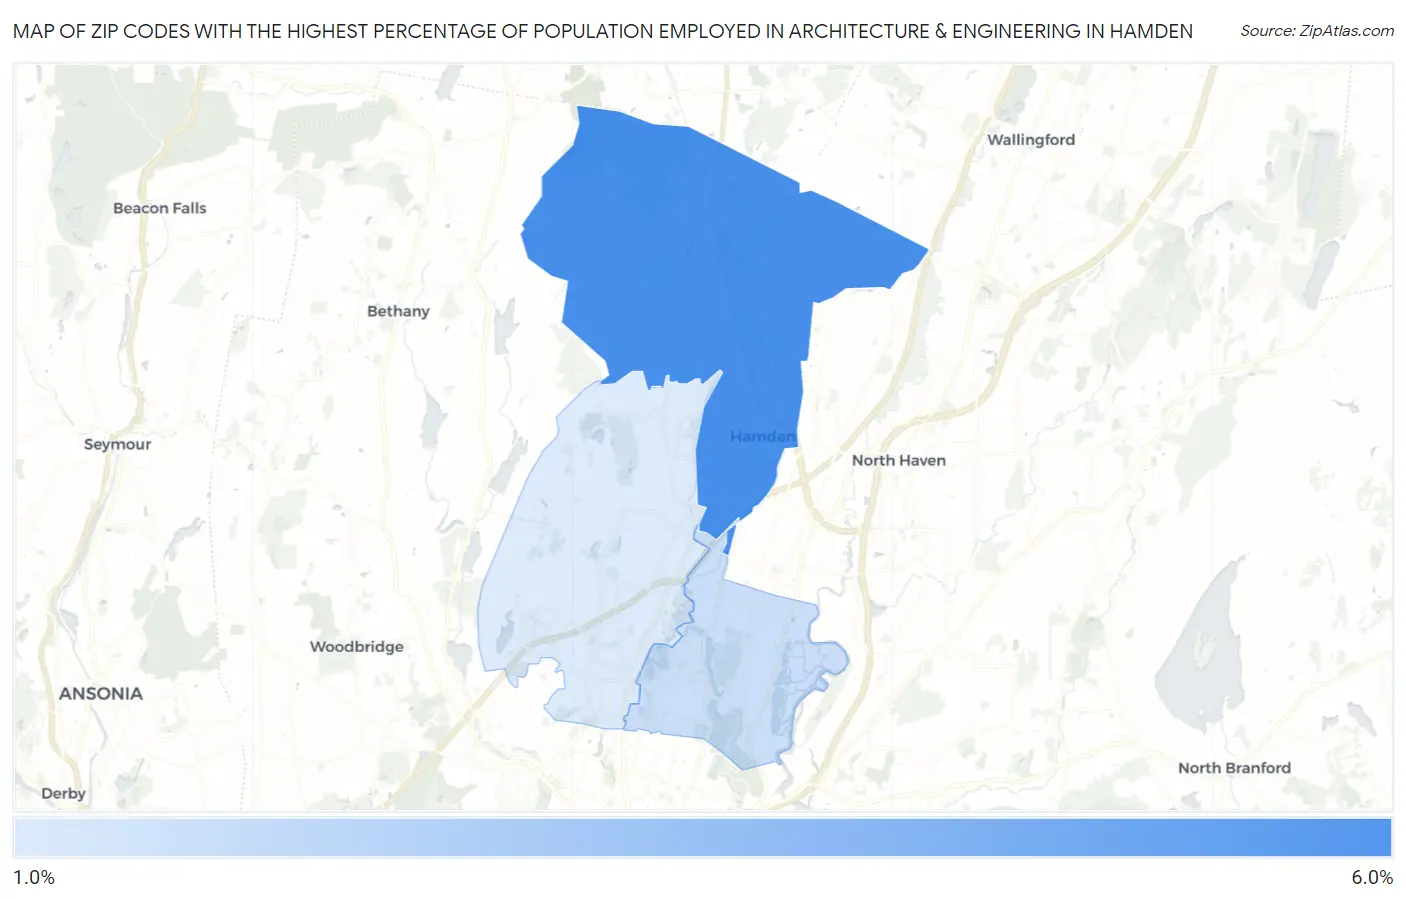
Map of Zip Codes with the Highest Percentage of Population Employed in Architecture & Engineering in Hamden
1.7%
5.2%
Zip Codes with the Highest Percentage of Population Employed in Architecture & Engineering in Hamden, CT
| Zip Code | % Employed | vs State | vs National | |
| 1. | 06518 | 5.2% | 2.6%(+2.60)#30 | 2.1%(+3.03)#1,530 |
| 2. | 06517 | 2.1% | 2.6%(-0.475)#137 | 2.1%(-0.048)#9,039 |
| 3. | 06514 | 1.7% | 2.6%(-0.893)#165 | 2.1%(-0.467)#11,612 |
1
Common Questions
What are the Top Zip Codes with the Highest Percentage of Population Employed in Architecture & Engineering in Hamden, CT?
Top Zip Codes with the Highest Percentage of Population Employed in Architecture & Engineering in Hamden, CT are:
What zip code has the Highest Percentage of Population Employed in Architecture & Engineering in Hamden, CT?
06518 has the Highest Percentage of Population Employed in Architecture & Engineering in Hamden, CT with 5.2%.
What is the Percentage of Population Employed in Architecture & Engineering in Connecticut?
Percentage of Population Employed in Architecture & Engineering in Connecticut is 2.6%.
What is the Percentage of Population Employed in Architecture & Engineering in the United States?
Percentage of Population Employed in Architecture & Engineering in the United States is 2.1%.