Zip Codes with the Highest Percentage of Population Employed in Food Preparation & Serving in West Hartford, CT
RELATED REPORTS & OPTIONS
Food Preparation & Serving
West Hartford
Compare Zip Codes
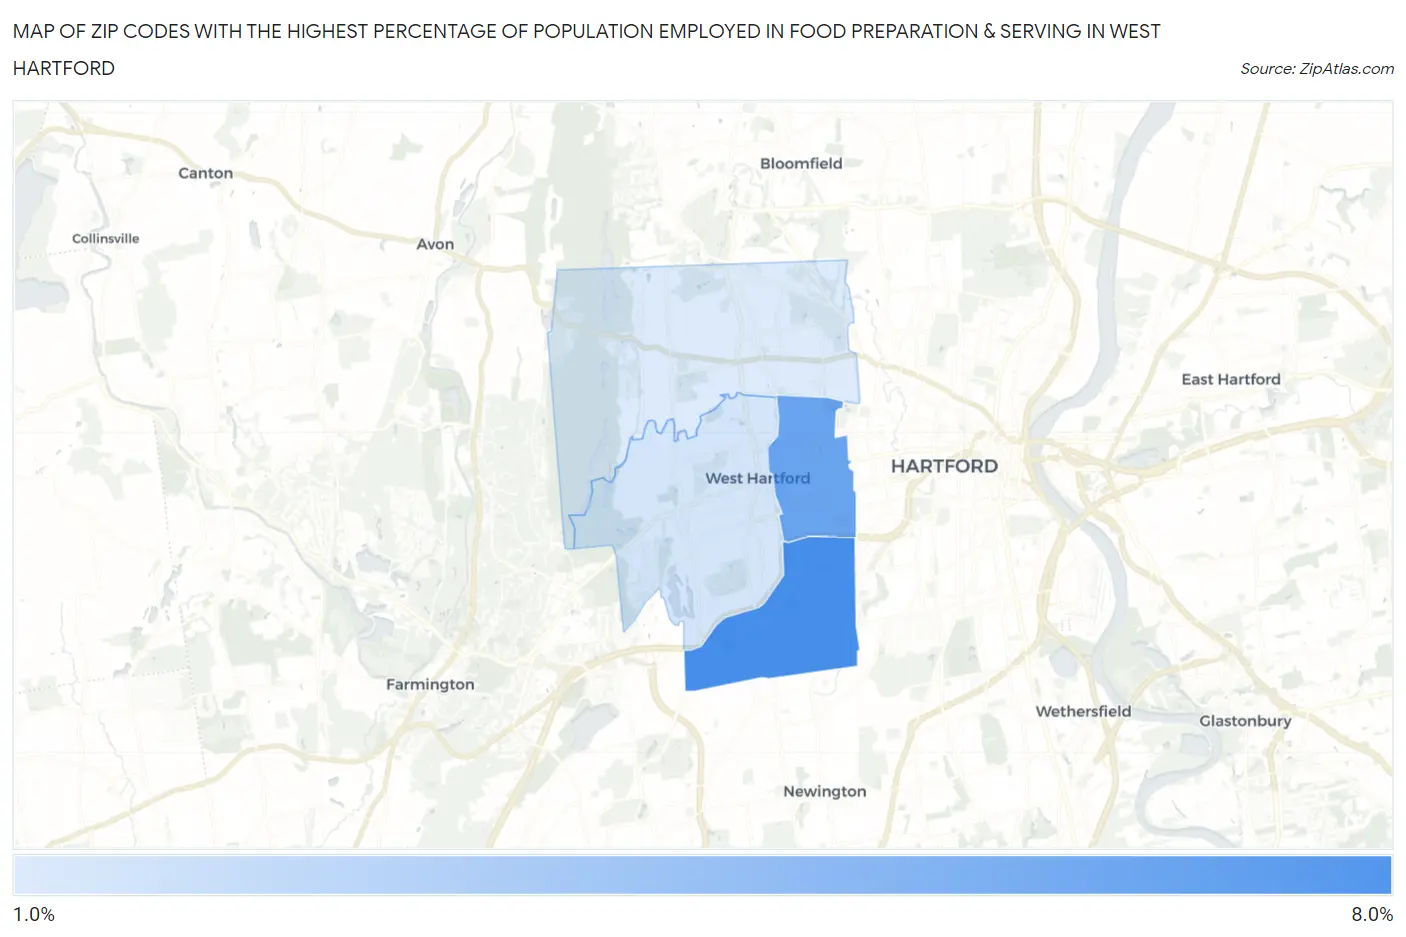
Map of Zip Codes with the Highest Percentage of Population Employed in Food Preparation & Serving in West Hartford
1.8%
7.7%
Zip Codes with the Highest Percentage of Population Employed in Food Preparation & Serving in West Hartford, CT
| Zip Code | % Employed | vs State | vs National | |
| 1. | 06110 | 7.7% | 4.7%(+2.97)#32 | 5.3%(+2.37)#5,282 |
| 2. | 06119 | 6.3% | 4.7%(+1.57)#63 | 5.3%(+0.967)#8,568 |
| 3. | 06107 | 2.2% | 4.7%(-2.52)#214 | 5.3%(-3.12)#24,204 |
| 4. | 06117 | 1.8% | 4.7%(-2.89)#226 | 5.3%(-3.49)#25,274 |
1
Common Questions
What are the Top 3 Zip Codes with the Highest Percentage of Population Employed in Food Preparation & Serving in West Hartford, CT?
Top 3 Zip Codes with the Highest Percentage of Population Employed in Food Preparation & Serving in West Hartford, CT are:
What zip code has the Highest Percentage of Population Employed in Food Preparation & Serving in West Hartford, CT?
06110 has the Highest Percentage of Population Employed in Food Preparation & Serving in West Hartford, CT with 7.7%.
What is the Percentage of Population Employed in Food Preparation & Serving in West Hartford, CT?
Percentage of Population Employed in Food Preparation & Serving in West Hartford is 4.2%.
What is the Percentage of Population Employed in Food Preparation & Serving in Connecticut?
Percentage of Population Employed in Food Preparation & Serving in Connecticut is 4.7%.
What is the Percentage of Population Employed in Food Preparation & Serving in the United States?
Percentage of Population Employed in Food Preparation & Serving in the United States is 5.3%.