Zip Codes with the Highest Percentage of Population Employed in Legal Services & Support in West Hartford, CT
RELATED REPORTS & OPTIONS
Legal Services & Support
West Hartford
Compare Zip Codes
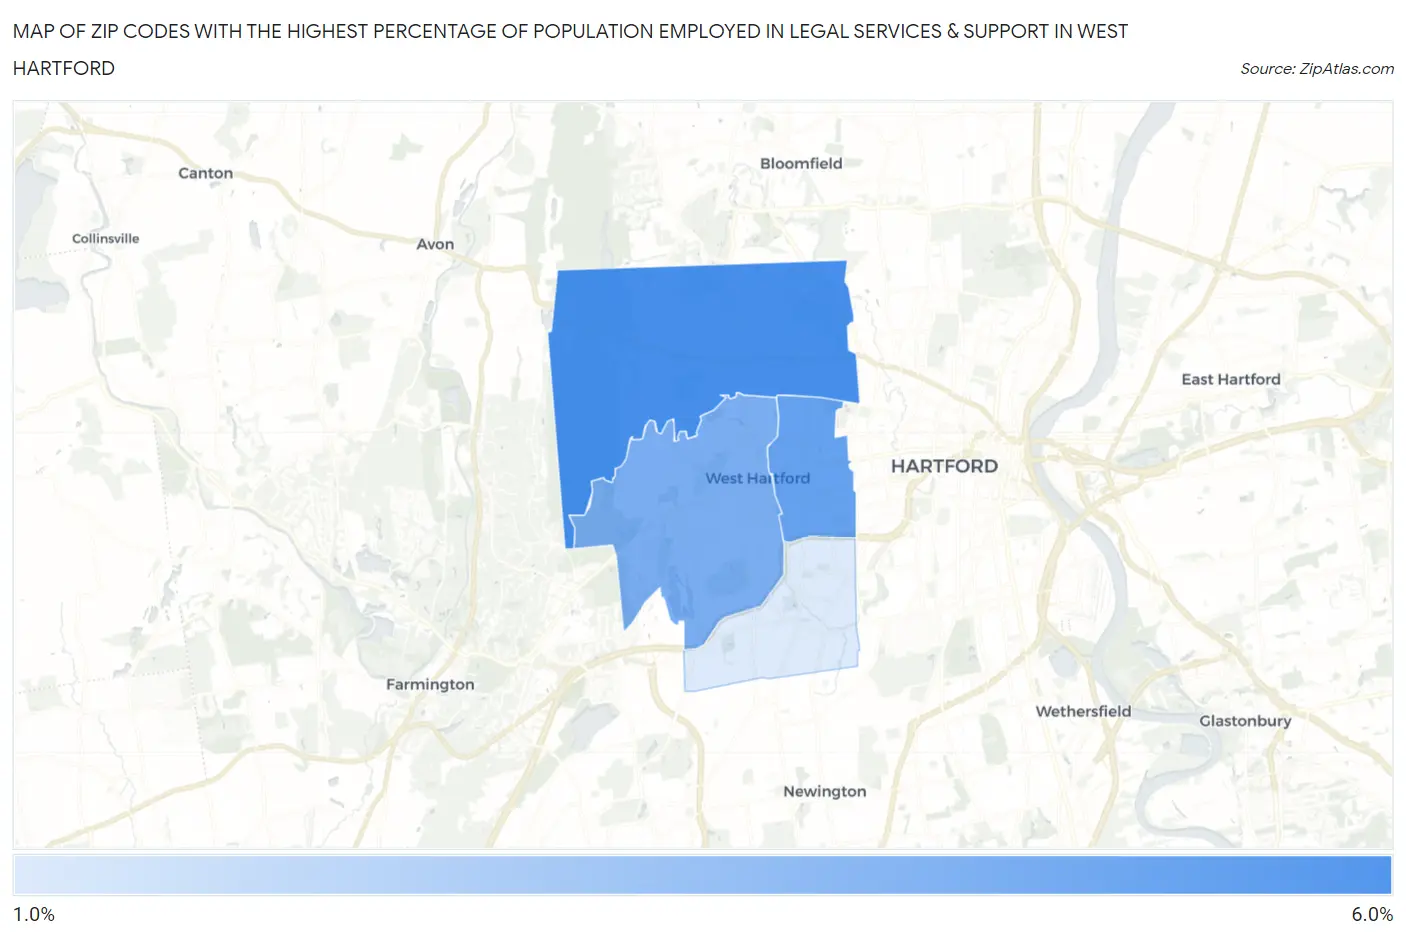
Map of Zip Codes with the Highest Percentage of Population Employed in Legal Services & Support in West Hartford
1.4%
5.1%
Zip Codes with the Highest Percentage of Population Employed in Legal Services & Support in West Hartford, CT
| Zip Code | % Employed | vs State | vs National | |
| 1. | 06117 | 5.1% | 1.4%(+3.64)#9 | 1.2%(+3.87)#705 |
| 2. | 06119 | 4.3% | 1.4%(+2.92)#17 | 1.2%(+3.15)#965 |
| 3. | 06107 | 3.8% | 1.4%(+2.38)#26 | 1.2%(+2.62)#1,231 |
| 4. | 06110 | 1.4% | 1.4%(-0.003)#100 | 1.2%(+0.231)#5,399 |
1
Common Questions
What are the Top 3 Zip Codes with the Highest Percentage of Population Employed in Legal Services & Support in West Hartford, CT?
Top 3 Zip Codes with the Highest Percentage of Population Employed in Legal Services & Support in West Hartford, CT are:
What zip code has the Highest Percentage of Population Employed in Legal Services & Support in West Hartford, CT?
06117 has the Highest Percentage of Population Employed in Legal Services & Support in West Hartford, CT with 5.1%.
What is the Percentage of Population Employed in Legal Services & Support in West Hartford, CT?
Percentage of Population Employed in Legal Services & Support in West Hartford is 3.9%.
What is the Percentage of Population Employed in Legal Services & Support in Connecticut?
Percentage of Population Employed in Legal Services & Support in Connecticut is 1.4%.
What is the Percentage of Population Employed in Legal Services & Support in the United States?
Percentage of Population Employed in Legal Services & Support in the United States is 1.2%.