Zip Codes with the Highest Percentage of Population Employed in Accommodation & Food Services in West Hartford, CT
RELATED REPORTS & OPTIONS
Accommodation & Food Services
West Hartford
Compare Zip Codes
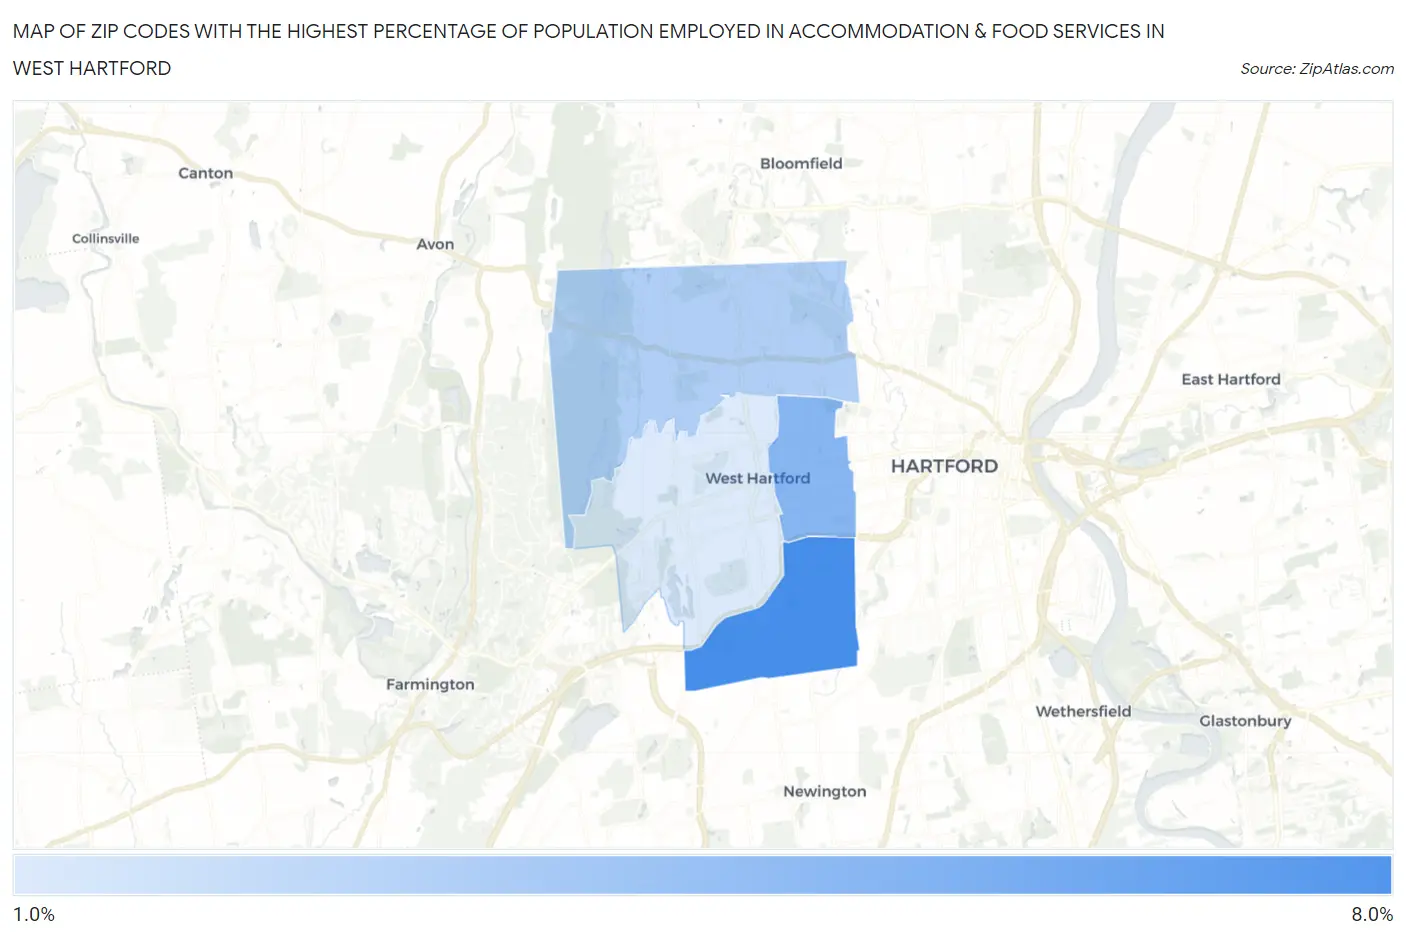
Map of Zip Codes with the Highest Percentage of Population Employed in Accommodation & Food Services in West Hartford
1.8%
7.4%
Zip Codes with the Highest Percentage of Population Employed in Accommodation & Food Services in West Hartford, CT
| Zip Code | % Employed | vs State | vs National | |
| 1. | 06110 | 7.4% | 5.6%(+1.73)#55 | 6.9%(+0.485)#9,336 |
| 2. | 06119 | 5.0% | 5.6%(-0.683)#125 | 6.9%(-1.93)#16,985 |
| 3. | 06117 | 3.4% | 5.6%(-2.23)#188 | 6.9%(-3.47)#22,073 |
| 4. | 06107 | 1.8% | 5.6%(-3.87)#245 | 6.9%(-5.12)#26,014 |
1
Common Questions
What are the Top 3 Zip Codes with the Highest Percentage of Population Employed in Accommodation & Food Services in West Hartford, CT?
Top 3 Zip Codes with the Highest Percentage of Population Employed in Accommodation & Food Services in West Hartford, CT are:
What zip code has the Highest Percentage of Population Employed in Accommodation & Food Services in West Hartford, CT?
06110 has the Highest Percentage of Population Employed in Accommodation & Food Services in West Hartford, CT with 7.4%.
What is the Percentage of Population Employed in Accommodation & Food Services in West Hartford, CT?
Percentage of Population Employed in Accommodation & Food Services in West Hartford is 4.1%.
What is the Percentage of Population Employed in Accommodation & Food Services in Connecticut?
Percentage of Population Employed in Accommodation & Food Services in Connecticut is 5.6%.
What is the Percentage of Population Employed in Accommodation & Food Services in the United States?
Percentage of Population Employed in Accommodation & Food Services in the United States is 6.9%.