Zip Codes with the Highest Percentage of Population with a Degree in Liberal Arts and History in East Hartford, CT
RELATED REPORTS & OPTIONS
Liberal Arts and History
East Hartford
Compare Zip Codes
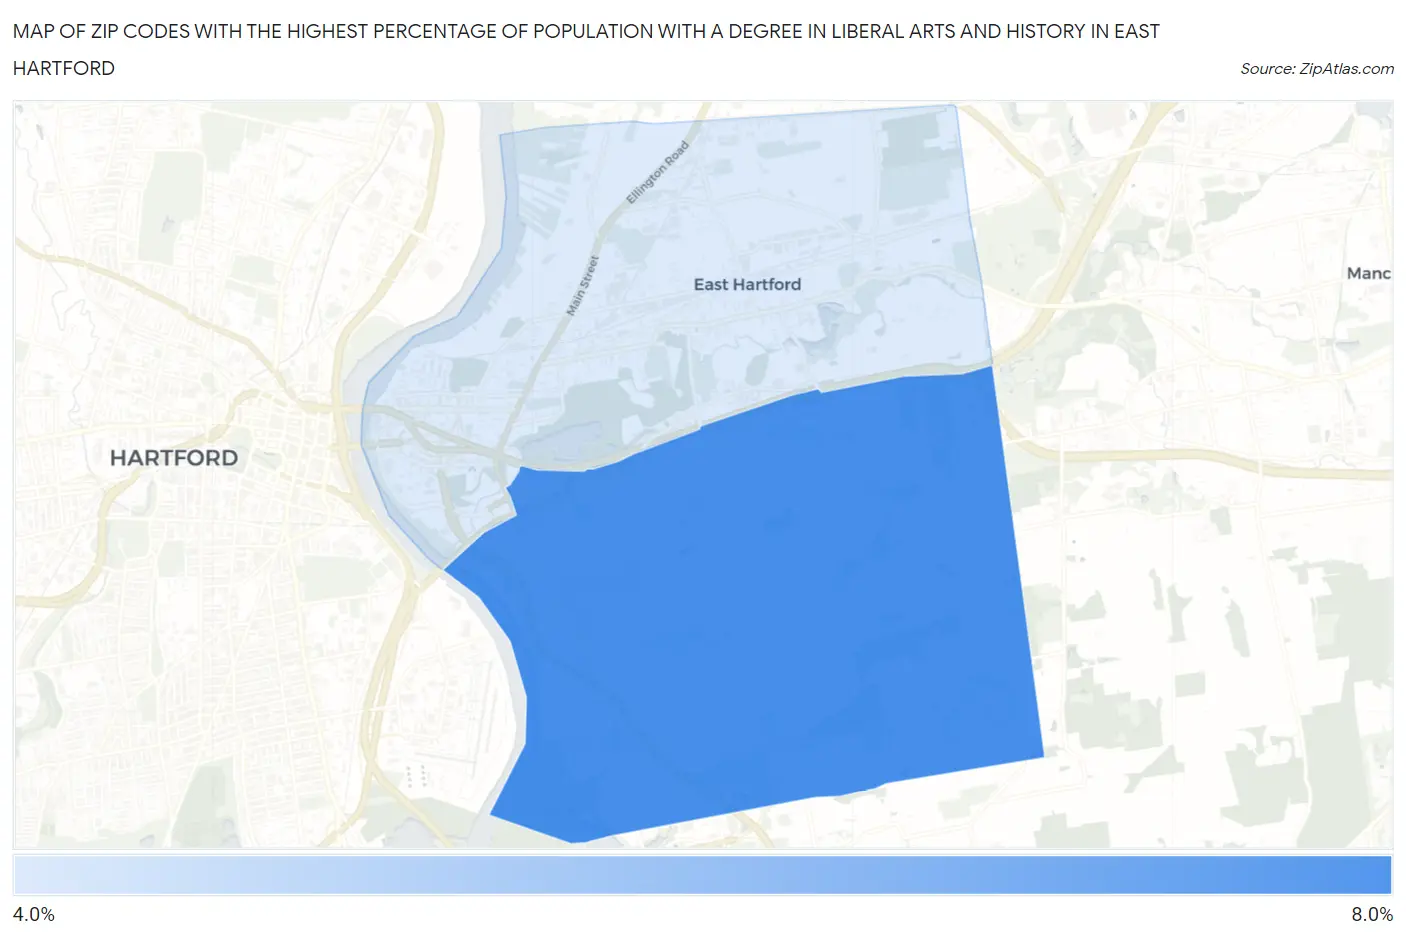
Map of Zip Codes with the Highest Percentage of Population with a Degree in Liberal Arts and History in East Hartford
4.4%
7.7%
Zip Codes with the Highest Percentage of Population with a Degree in Liberal Arts and History in East Hartford, CT
| Zip Code | % Graduates | vs State | vs National | |
| 1. | 06118 | 7.7% | 5.5%(+2.25)#41 | 4.9%(+2.86)#5,251 |
| 2. | 06108 | 4.4% | 5.5%(-1.08)#168 | 4.9%(-0.461)#13,259 |
1
Common Questions
What are the Top Zip Codes with the Highest Percentage of Population with a Degree in Liberal Arts and History in East Hartford, CT?
Top Zip Codes with the Highest Percentage of Population with a Degree in Liberal Arts and History in East Hartford, CT are:
What zip code has the Highest Percentage of Population with a Degree in Liberal Arts and History in East Hartford, CT?
06118 has the Highest Percentage of Population with a Degree in Liberal Arts and History in East Hartford, CT with 7.7%.
What is the Percentage of Population with a Degree in Liberal Arts and History in East Hartford, CT?
Percentage of Population with a Degree in Liberal Arts and History in East Hartford is 6.5%.
What is the Percentage of Population with a Degree in Liberal Arts and History in Connecticut?
Percentage of Population with a Degree in Liberal Arts and History in Connecticut is 5.5%.
What is the Percentage of Population with a Degree in Liberal Arts and History in the United States?
Percentage of Population with a Degree in Liberal Arts and History in the United States is 4.9%.