Zip Codes with the Highest Percentage of Population with a Degree in Visual and Performing Arts in East Hartford, CT
RELATED REPORTS & OPTIONS
Visual and Performing Arts
East Hartford
Compare Zip Codes
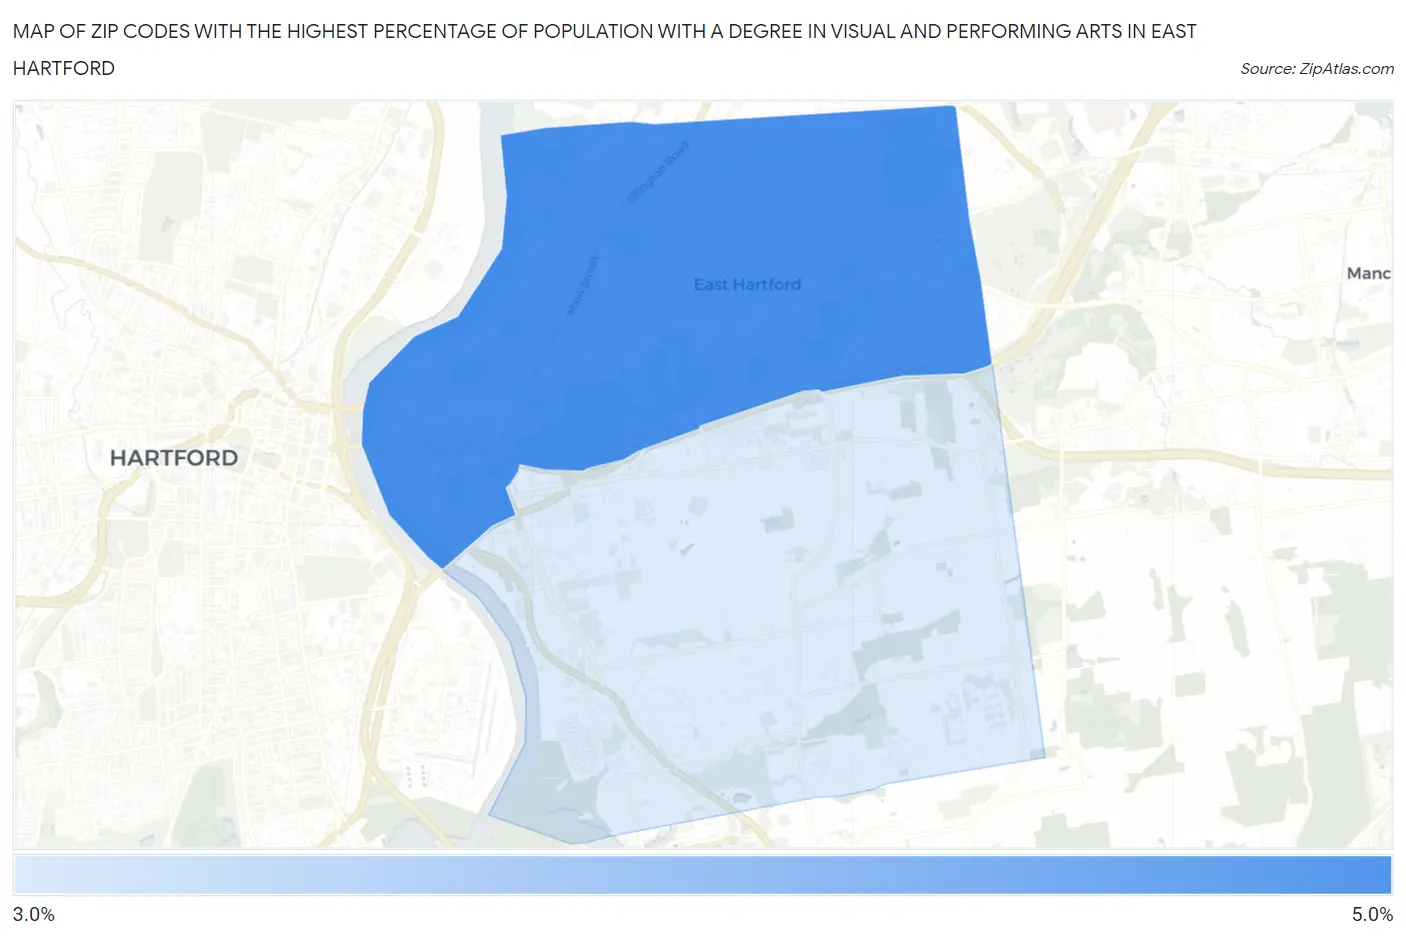
Map of Zip Codes with the Highest Percentage of Population with a Degree in Visual and Performing Arts in East Hartford
3.6%
4.9%
Zip Codes with the Highest Percentage of Population with a Degree in Visual and Performing Arts in East Hartford, CT
| Zip Code | % Graduates | vs State | vs National | |
| 1. | 06108 | 4.9% | 4.7%(+0.230)#119 | 4.3%(+0.696)#6,770 |
| 2. | 06118 | 3.6% | 4.7%(-1.08)#170 | 4.3%(-0.612)#10,375 |
1
Common Questions
What are the Top Zip Codes with the Highest Percentage of Population with a Degree in Visual and Performing Arts in East Hartford, CT?
Top Zip Codes with the Highest Percentage of Population with a Degree in Visual and Performing Arts in East Hartford, CT are:
What zip code has the Highest Percentage of Population with a Degree in Visual and Performing Arts in East Hartford, CT?
06108 has the Highest Percentage of Population with a Degree in Visual and Performing Arts in East Hartford, CT with 4.9%.
What is the Percentage of Population with a Degree in Visual and Performing Arts in East Hartford, CT?
Percentage of Population with a Degree in Visual and Performing Arts in East Hartford is 4.1%.
What is the Percentage of Population with a Degree in Visual and Performing Arts in Connecticut?
Percentage of Population with a Degree in Visual and Performing Arts in Connecticut is 4.7%.
What is the Percentage of Population with a Degree in Visual and Performing Arts in the United States?
Percentage of Population with a Degree in Visual and Performing Arts in the United States is 4.3%.