Zip Codes with the Highest Costs of Housing as Percentage of Income in East Hartford, CT
RELATED REPORTS & OPTIONS
Highest Housing Costs / Income
East Hartford
Compare Zip Codes
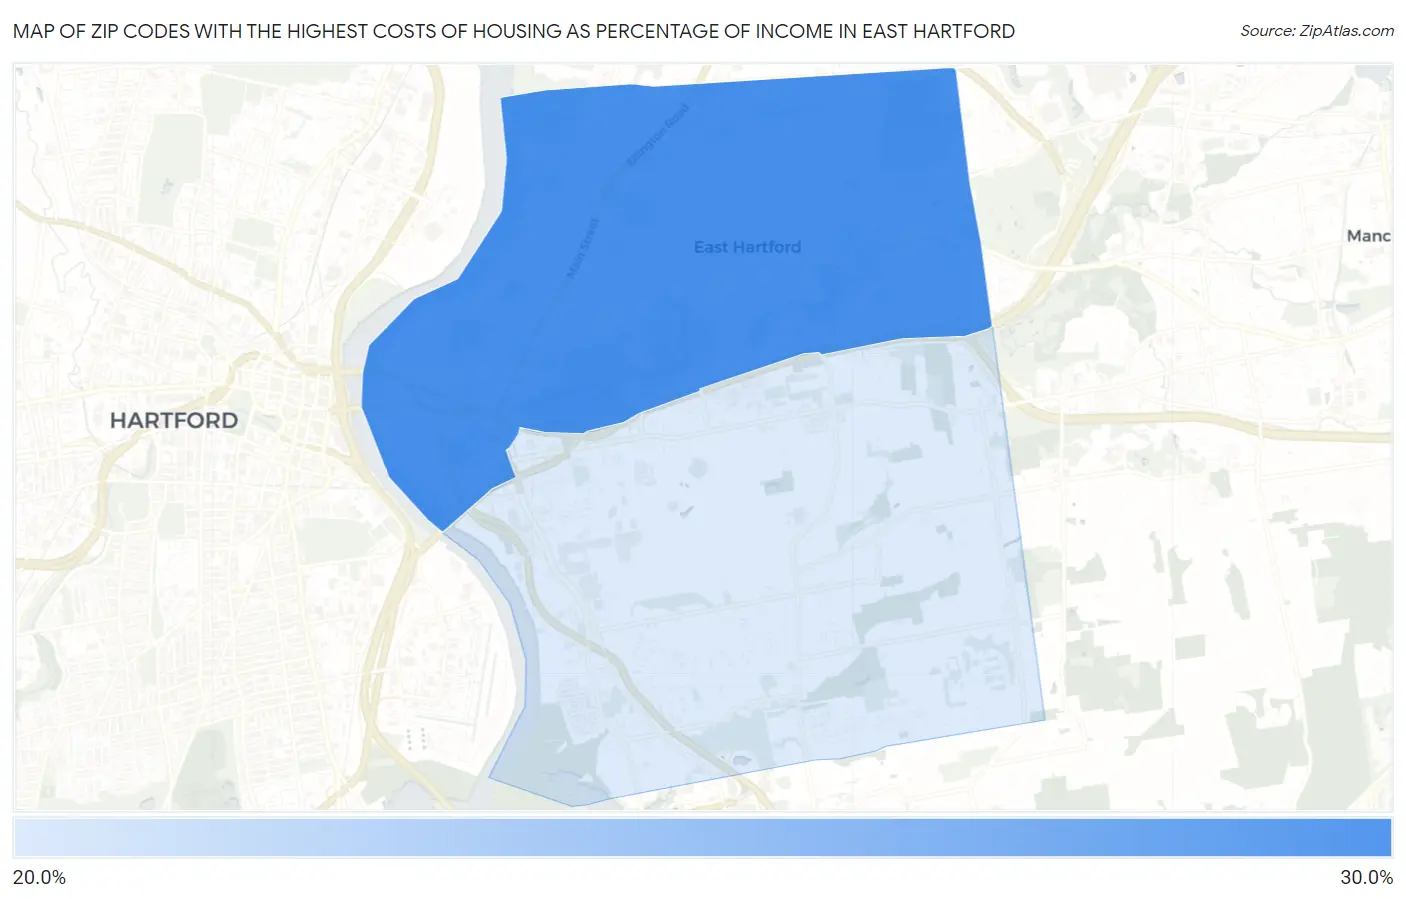
Map of Zip Codes with the Highest Costs of Housing as Percentage of Income in East Hartford
22.9%
28.0%
Zip Codes with the Highest Costs of Housing as Percentage of Income in East Hartford, CT
| Zip Code | Housing Costs / Income | vs State | vs National | |
| 1. | 06108 | 28.0% | 21.8%(+6.22)#33 | 20.4%(+7.65)#1,506 |
| 2. | 06118 | 22.9% | 21.8%(+1.06)#76 | 20.4%(+2.48)#4,790 |
1
Common Questions
What are the Top Zip Codes with the Highest Costs of Housing as Percentage of Income in East Hartford, CT?
Top Zip Codes with the Highest Costs of Housing as Percentage of Income in East Hartford, CT are:
What zip code has the Highest Costs of Housing as Percentage of Income in East Hartford, CT?
06108 has the Highest Costs of Housing as Percentage of Income in East Hartford, CT with 28.0%.
What is the Average Housing Costs as Percentage of Income in East Hartford, CT?
Average Housing Costs as Percentage of Income in East Hartford is 25.0%.
What is the Average Housing Costs as Percentage of Income in Connecticut?
Average Housing Costs as Percentage of Income in Connecticut is 21.8%.
What is the Average Housing Costs as Percentage of Income in the United States?
Average Housing Costs as Percentage of Income in the United States is 20.4%.