Zip Codes with the Highest Percentage of Population Employed in Computer, Engineering & Science in Woodland, CA
RELATED REPORTS & OPTIONS
Computer, Engineering & Science
Woodland
Compare Zip Codes
Map of Zip Codes with the Highest Percentage of Population Employed in Computer, Engineering & Science in Woodland
4.5%
6.1%
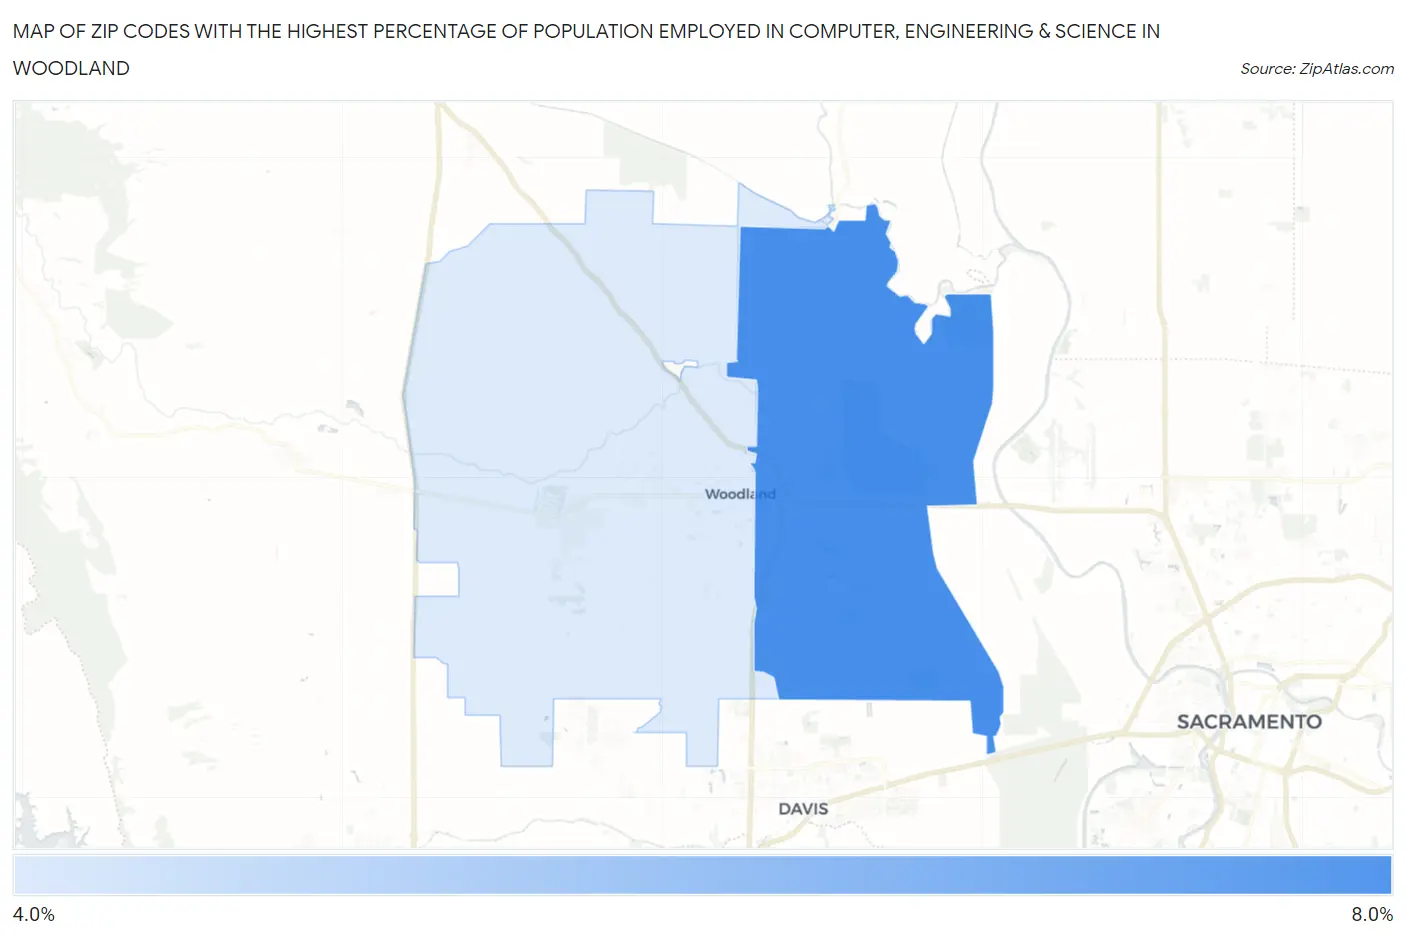
Zip Codes with the Highest Percentage of Population Employed in Computer, Engineering & Science in Woodland, CA
| Zip Code | % Employed | vs State | vs National | |
| 1. | 95776 | 6.1% | 8.0%(-1.83)#711 | 6.8%(-0.633)#8,507 |
| 2. | 95695 | 4.5% | 8.0%(-3.51)#964 | 6.8%(-2.31)#12,956 |
1
Common Questions
What are the Top Zip Codes with the Highest Percentage of Population Employed in Computer, Engineering & Science in Woodland, CA?
Top Zip Codes with the Highest Percentage of Population Employed in Computer, Engineering & Science in Woodland, CA are:
What zip code has the Highest Percentage of Population Employed in Computer, Engineering & Science in Woodland, CA?
95776 has the Highest Percentage of Population Employed in Computer, Engineering & Science in Woodland, CA with 6.1%.
What is the Percentage of Population Employed in Computer, Engineering & Science in Woodland, CA?
Percentage of Population Employed in Computer, Engineering & Science in Woodland is 5.3%.
What is the Percentage of Population Employed in Computer, Engineering & Science in California?
Percentage of Population Employed in Computer, Engineering & Science in California is 8.0%.
What is the Percentage of Population Employed in Computer, Engineering & Science in the United States?
Percentage of Population Employed in Computer, Engineering & Science in the United States is 6.8%.