Zip Codes with the Highest Percentage of Population with a Degree in Physical and Health Sciences in Pleasanton, CA
RELATED REPORTS & OPTIONS
Physical and Health Sciences
Pleasanton
Compare Zip Codes
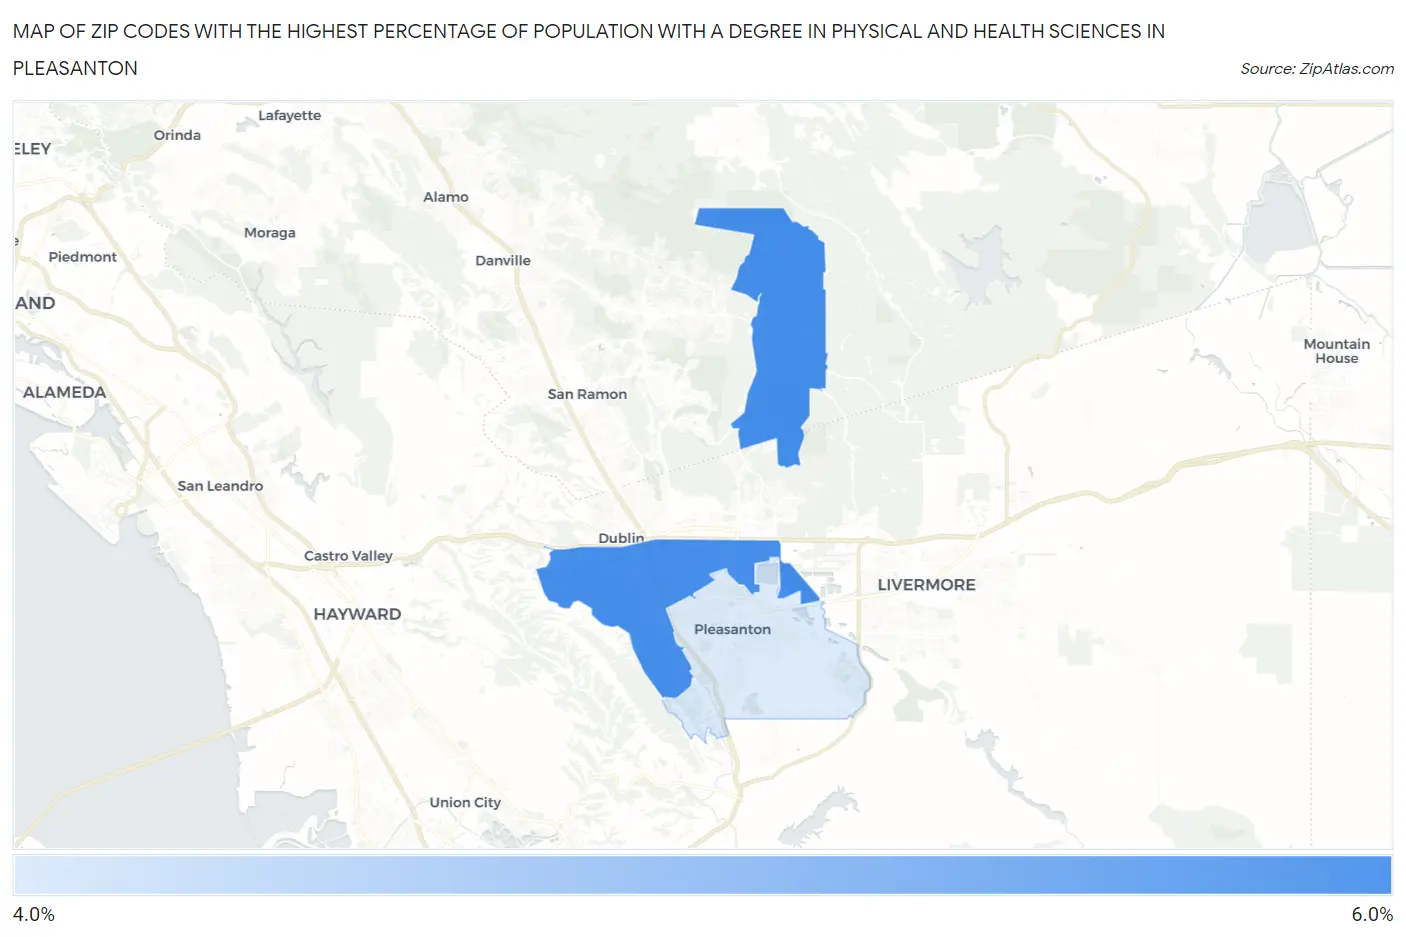
Map of Zip Codes with the Highest Percentage of Population with a Degree in Physical and Health Sciences in Pleasanton
4.4%
5.0%
Zip Codes with the Highest Percentage of Population with a Degree in Physical and Health Sciences in Pleasanton, CA
| Zip Code | % Graduates | vs State | vs National | |
| 1. | 94588 | 5.0% | 3.1%(+1.93)#228 | 3.1%(+1.94)#4,479 |
| 2. | 94566 | 4.4% | 3.1%(+1.26)#297 | 3.1%(+1.27)#5,818 |
1
Common Questions
What are the Top Zip Codes with the Highest Percentage of Population with a Degree in Physical and Health Sciences in Pleasanton, CA?
Top Zip Codes with the Highest Percentage of Population with a Degree in Physical and Health Sciences in Pleasanton, CA are:
What zip code has the Highest Percentage of Population with a Degree in Physical and Health Sciences in Pleasanton, CA?
94588 has the Highest Percentage of Population with a Degree in Physical and Health Sciences in Pleasanton, CA with 5.0%.
What is the Percentage of Population with a Degree in Physical and Health Sciences in Pleasanton, CA?
Percentage of Population with a Degree in Physical and Health Sciences in Pleasanton is 4.7%.
What is the Percentage of Population with a Degree in Physical and Health Sciences in California?
Percentage of Population with a Degree in Physical and Health Sciences in California is 3.1%.
What is the Percentage of Population with a Degree in Physical and Health Sciences in the United States?
Percentage of Population with a Degree in Physical and Health Sciences in the United States is 3.1%.