Zip Codes with the Highest Percentage of Population Employed in Office & Administration in Brea, CA
RELATED REPORTS & OPTIONS
Office & Administration
Brea
Compare Zip Codes
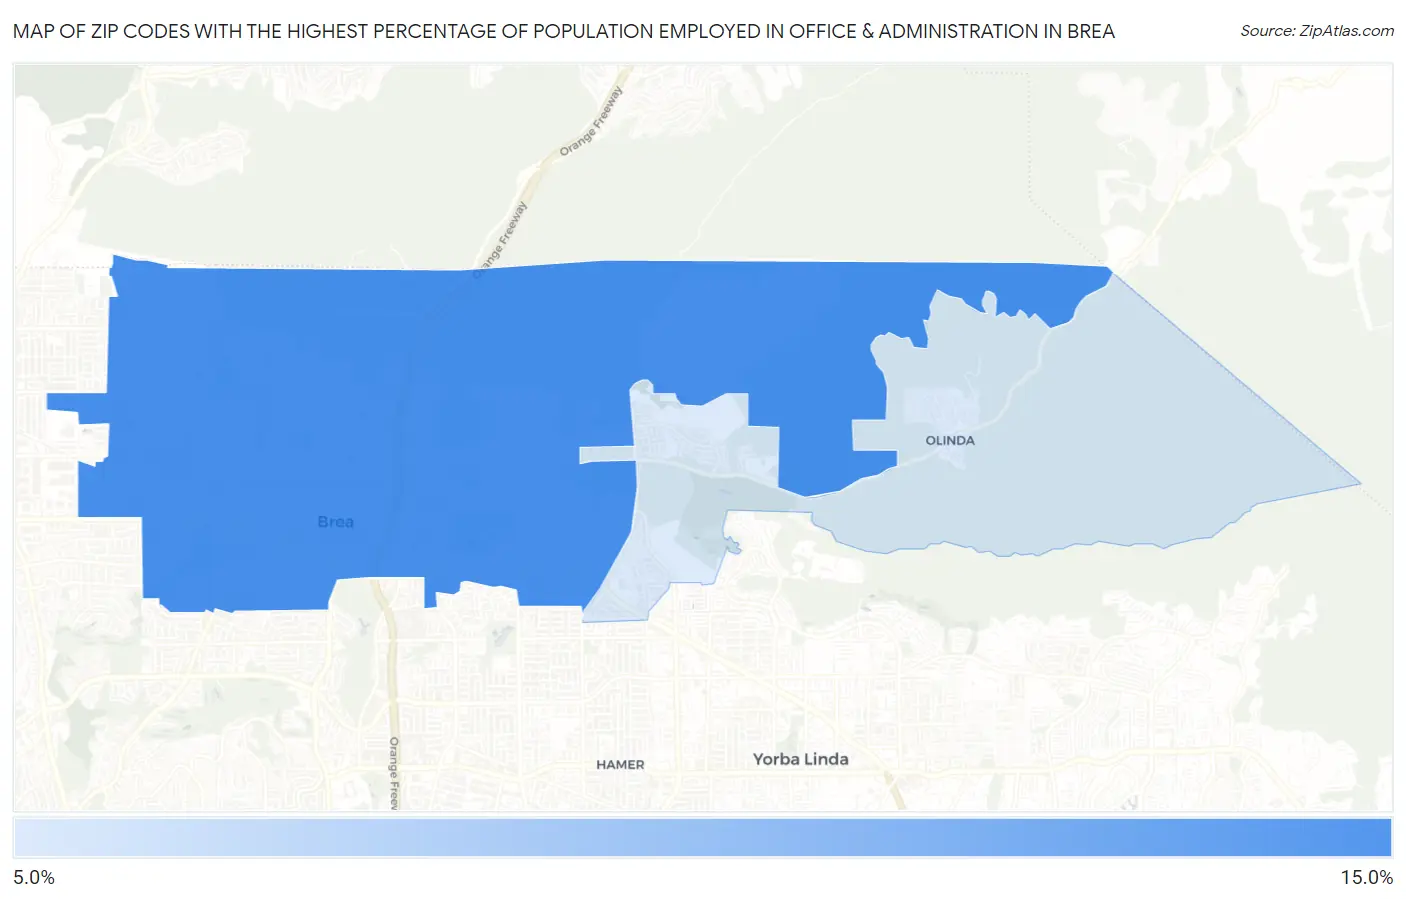
Map of Zip Codes with the Highest Percentage of Population Employed in Office & Administration in Brea
8.0%
13.1%
Zip Codes with the Highest Percentage of Population Employed in Office & Administration in Brea, CA
| Zip Code | % Employed | vs State | vs National | |
| 1. | 92821 | 13.1% | 10.5%(+2.63)#295 | 10.9%(+2.28)#7,735 |
| 2. | 92823 | 8.0% | 10.5%(-2.53)#1,170 | 10.9%(-2.88)#23,083 |
1
Common Questions
What are the Top Zip Codes with the Highest Percentage of Population Employed in Office & Administration in Brea, CA?
Top Zip Codes with the Highest Percentage of Population Employed in Office & Administration in Brea, CA are:
What zip code has the Highest Percentage of Population Employed in Office & Administration in Brea, CA?
92821 has the Highest Percentage of Population Employed in Office & Administration in Brea, CA with 13.1%.
What is the Percentage of Population Employed in Office & Administration in Brea, CA?
Percentage of Population Employed in Office & Administration in Brea is 12.5%.
What is the Percentage of Population Employed in Office & Administration in California?
Percentage of Population Employed in Office & Administration in California is 10.5%.
What is the Percentage of Population Employed in Office & Administration in the United States?
Percentage of Population Employed in Office & Administration in the United States is 10.9%.