Zip Codes with the Highest Percentage of Population Employed in Office & Administration in Eureka Springs, AR
RELATED REPORTS & OPTIONS
Office & Administration
Eureka Springs
Compare Zip Codes
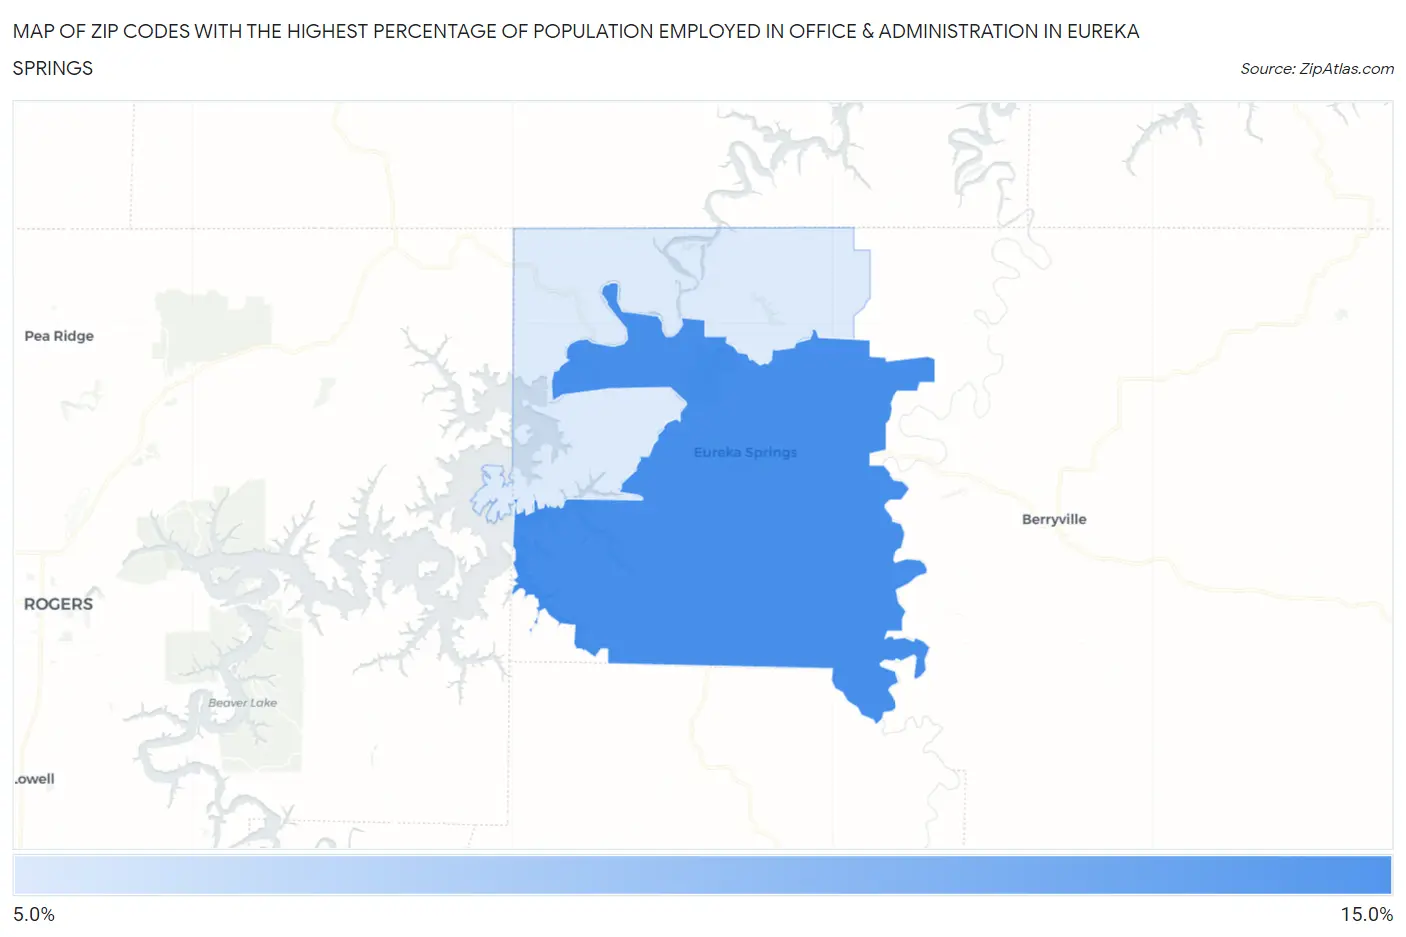
Map of Zip Codes with the Highest Percentage of Population Employed in Office & Administration in Eureka Springs
7.5%
11.7%
Zip Codes with the Highest Percentage of Population Employed in Office & Administration in Eureka Springs, AR
| Zip Code | % Employed | vs State | vs National | |
| 1. | 72632 | 11.7% | 10.8%(+0.863)#203 | 10.9%(+0.794)#11,792 |
| 2. | 72631 | 7.5% | 10.8%(-3.31)#390 | 10.9%(-3.38)#24,216 |
1
Common Questions
What are the Top Zip Codes with the Highest Percentage of Population Employed in Office & Administration in Eureka Springs, AR?
Top Zip Codes with the Highest Percentage of Population Employed in Office & Administration in Eureka Springs, AR are:
What zip code has the Highest Percentage of Population Employed in Office & Administration in Eureka Springs, AR?
72632 has the Highest Percentage of Population Employed in Office & Administration in Eureka Springs, AR with 11.7%.
What is the Percentage of Population Employed in Office & Administration in Eureka Springs, AR?
Percentage of Population Employed in Office & Administration in Eureka Springs is 9.9%.
What is the Percentage of Population Employed in Office & Administration in Arkansas?
Percentage of Population Employed in Office & Administration in Arkansas is 10.8%.
What is the Percentage of Population Employed in Office & Administration in the United States?
Percentage of Population Employed in Office & Administration in the United States is 10.9%.